Fig. 10
Download original image
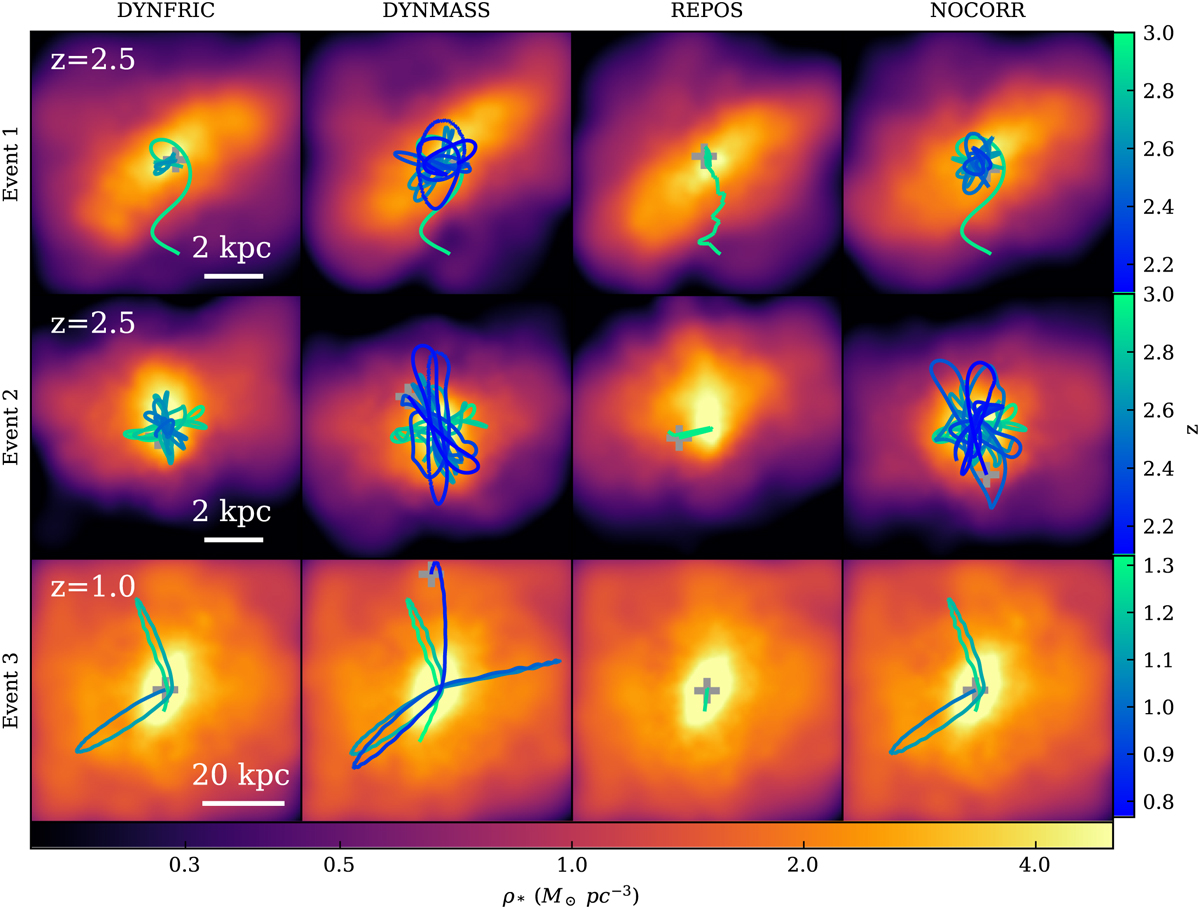
Stellar density map along the z-axis with depth of 10 kpc in the top and central row and 70 kpc in the bottom row, centred on the central BH (BHcen) of Event 1 in the top row, Event 2 in the central row and Event 3 in the bottom row. The maps of stellar density refer to the redshift indicated on the left panel of each row. In each panel, the curve show the orbit of the satellite BH (BHsat) involved in the merger event, colour-coded according to the redshift. The crosses indicate the last position of the satellite BH before either the merging event or the end of the simulations (see Sect. 6). The columns display the BH evolution using different sub-resolution prescriptions, from the left: using DF (first column), using a boosted dynamical mass (second), adopting the repositioning scheme (third) and finally without any correction for BH dynamics (fourth).
Current usage metrics show cumulative count of Article Views (full-text article views including HTML views, PDF and ePub downloads, according to the available data) and Abstracts Views on Vision4Press platform.
Data correspond to usage on the plateform after 2015. The current usage metrics is available 48-96 hours after online publication and is updated daily on week days.
Initial download of the metrics may take a while.