Fig. 1
Download original image
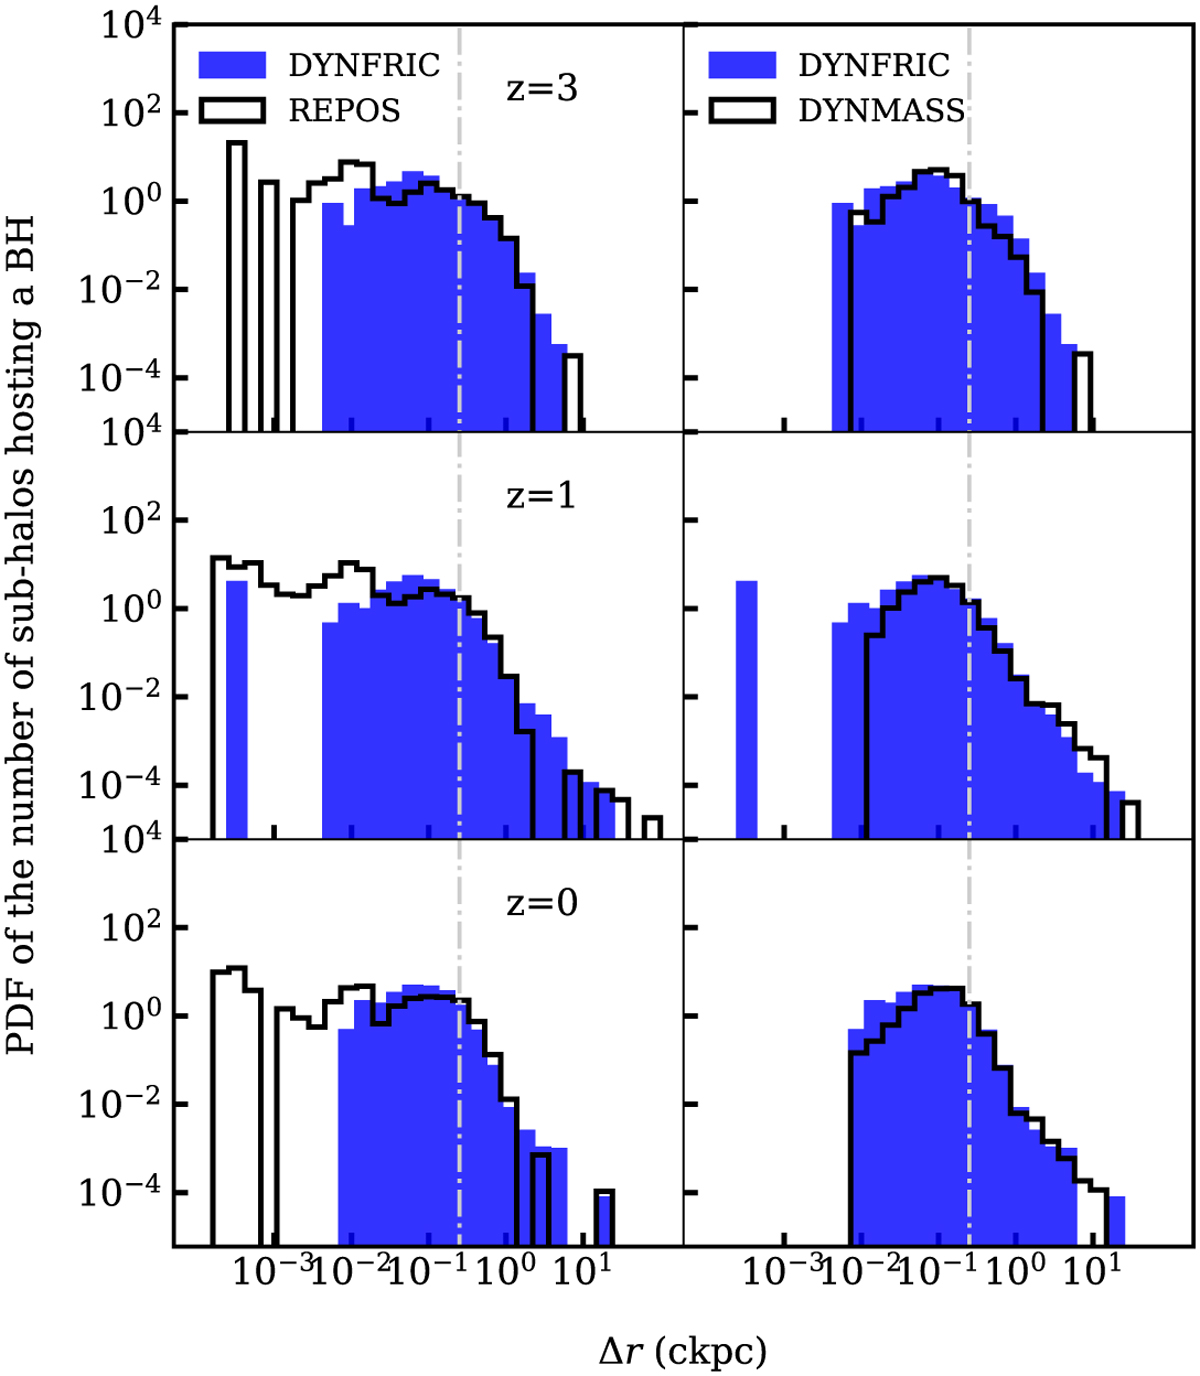
Probability density distribution of the distances between sub-halos identified by SubFind and the closest BH particle within the RHMS of each sub-halo of Cl 13, D9 regions, and Cosmobox. The rows show the results obtained at different redshifts: z = 3 (up), z = 1 (central), and z = 0 (bottom). The column report the results comparing DYNFRIC and REPOS on the left, and DYNFRIC and DYNMASS on the right side. We include a dashed-dot line in each plot indicating the softening length of the BH as a reference for the spatial resolution of the simulation.
Current usage metrics show cumulative count of Article Views (full-text article views including HTML views, PDF and ePub downloads, according to the available data) and Abstracts Views on Vision4Press platform.
Data correspond to usage on the plateform after 2015. The current usage metrics is available 48-96 hours after online publication and is updated daily on week days.
Initial download of the metrics may take a while.