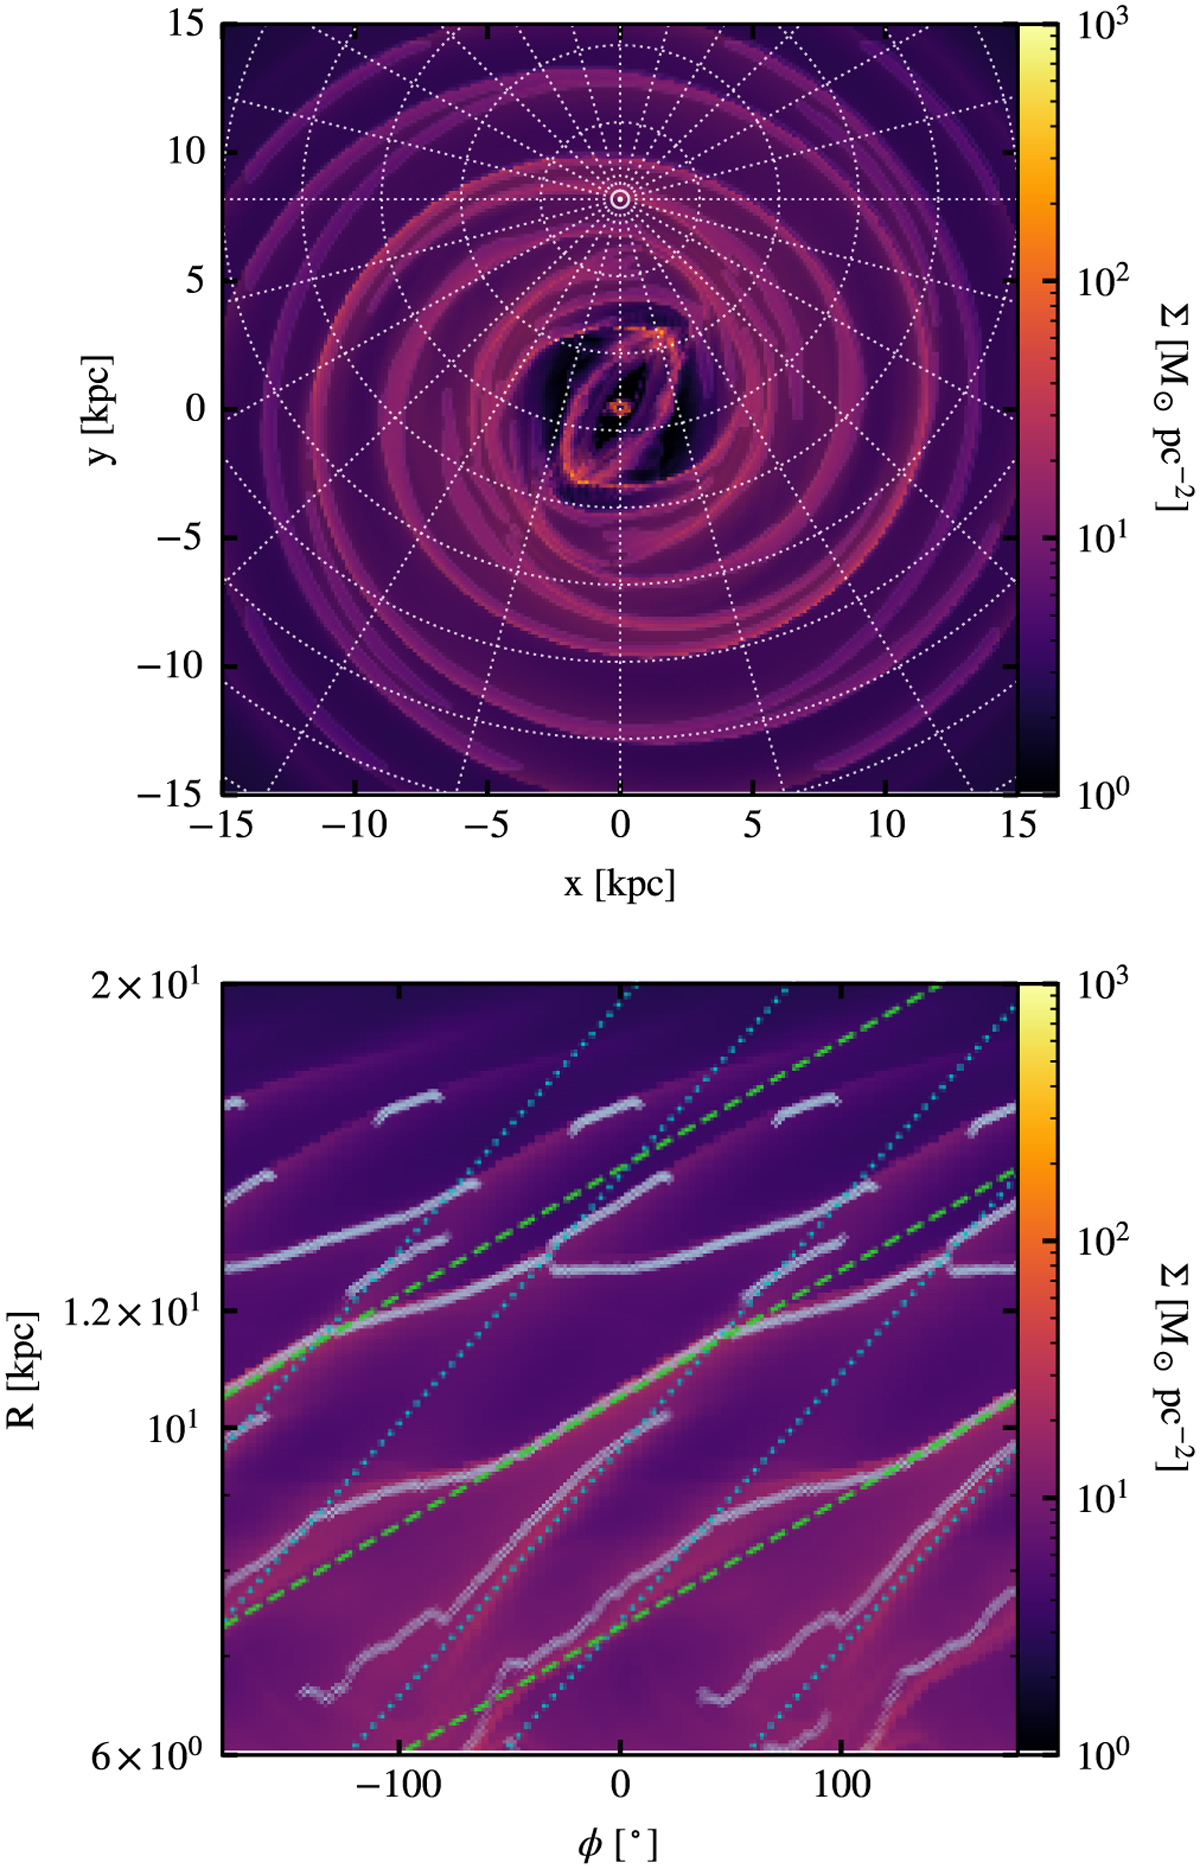
Fig. 9
Download original image
Spiral arm structure. The top plot is the x − y density projection of our simulation at t = 441 Myr. Spiral arms have been enhanced in this image using the mask generated by FILFINDER to brighten overdensities and darken other regions. The bottom panel is the polar decomposition of the density map of the top panel, focusing on the region with galactocentric radius 6 < R < 20 kpc. The blue dotted lines are the positions of the spiral arms according to the second half of Eq. (17). The green dashed lines are the spiral arms generated by the rotation of the bar, with a pitch angle of 6.5° around the outer Lindblad resonance, R = 10.14 kpc. The light blue lines indicate the spiral arm pattern extracted with FILFINDER.
Current usage metrics show cumulative count of Article Views (full-text article views including HTML views, PDF and ePub downloads, according to the available data) and Abstracts Views on Vision4Press platform.
Data correspond to usage on the plateform after 2015. The current usage metrics is available 48-96 hours after online publication and is updated daily on week days.
Initial download of the metrics may take a while.