Fig. 8
Download original image
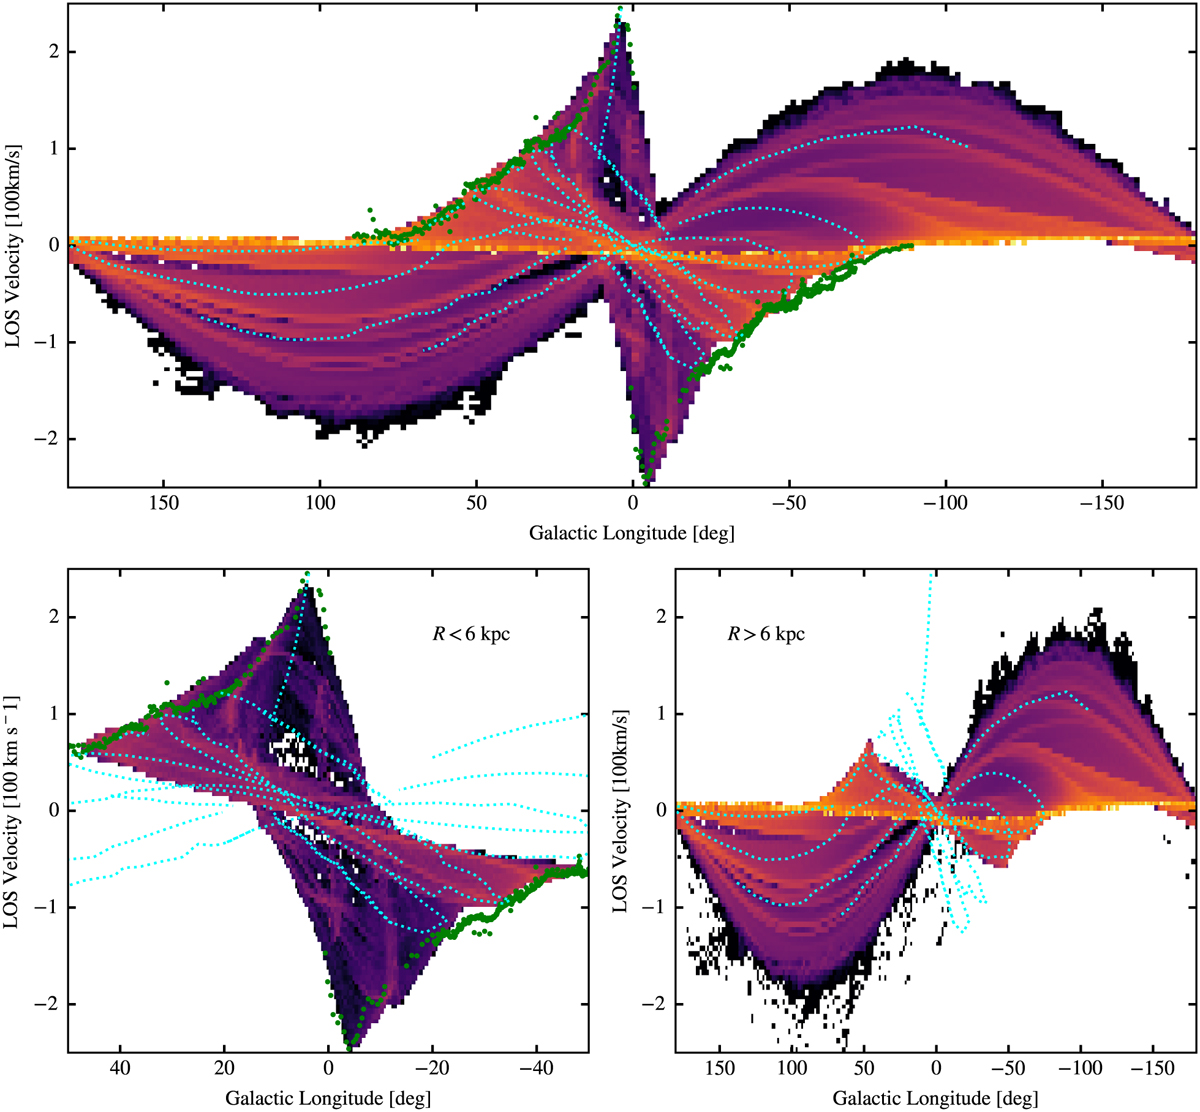
Longitude–velocity maps of the simulation observed from the Sun’s position (placed at the origin of the overlayed coordinate system in Fig. 9). The bar major axis is rotated by 28 degrees from the LOS passing through the Galactic centre. Overlayed blue dashed lines are the spiral arm tracks of Reid et al. (2016, 2019) and McClure-Griffiths et al. (2004). The green points are the terminal velocities from H I and CO observations. Top: full diagram. Bottom: zoom-in between l = −60° & +60°. The left plot only takes into account gas that lies at R < 6 kpc from the centre, and the right one only considers gas at R > 6 kpc.
Current usage metrics show cumulative count of Article Views (full-text article views including HTML views, PDF and ePub downloads, according to the available data) and Abstracts Views on Vision4Press platform.
Data correspond to usage on the plateform after 2015. The current usage metrics is available 48-96 hours after online publication and is updated daily on week days.
Initial download of the metrics may take a while.