Fig. 6
Download original image
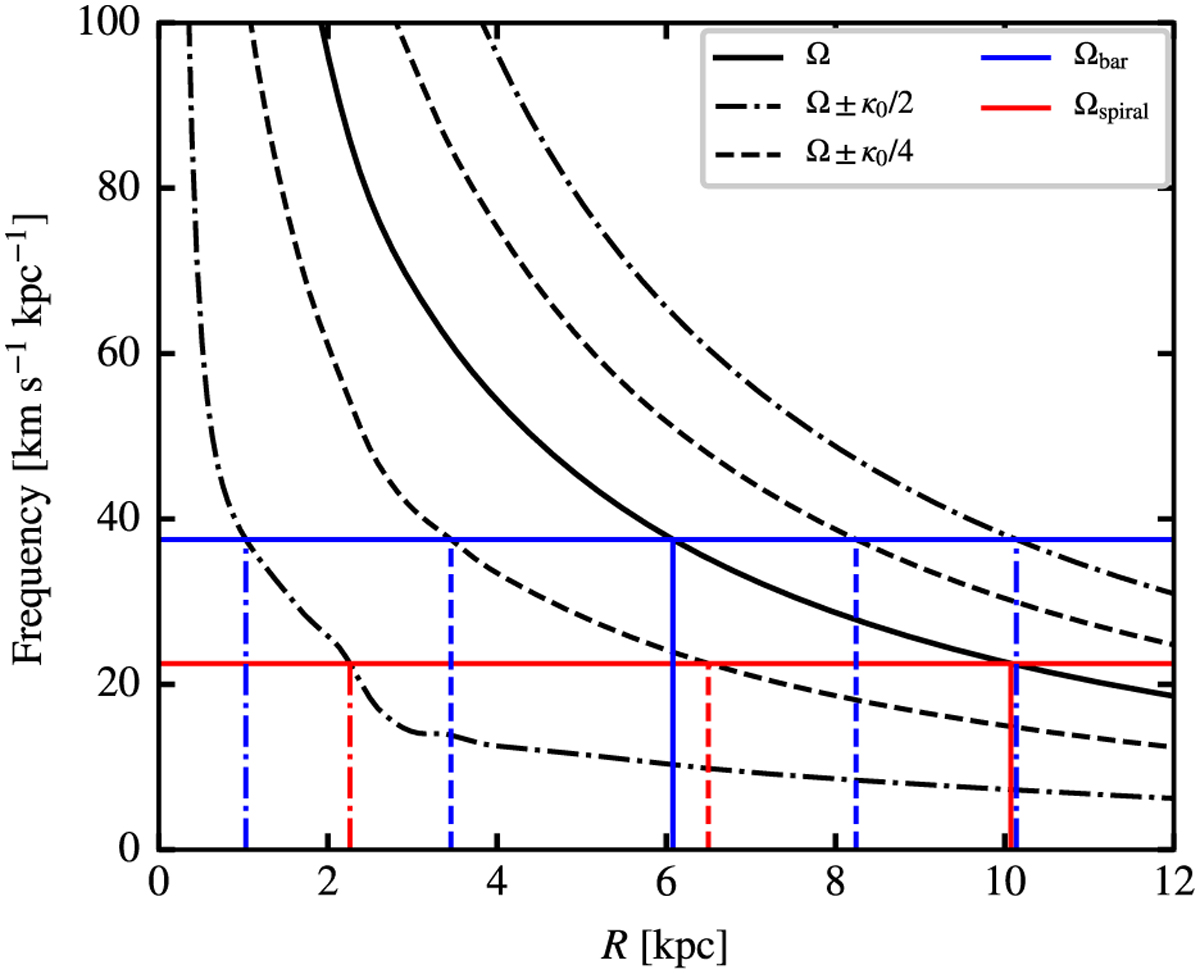
Frequency curve as a function of Galactic radius. The solid black line is the rotational frequency curve of the potential, whereas the dashed and dot-dashed lines are rotional frequency plus or minus 0.25 and 0.5 times the epicyclic frequency, ![]() . The horizontal blue and red lines are the pattern speed of the bar and the spiral arms, respectively. The vertical dashed and dot-dashed lines are the corresponding resonances for bar and spiral arms.
. The horizontal blue and red lines are the pattern speed of the bar and the spiral arms, respectively. The vertical dashed and dot-dashed lines are the corresponding resonances for bar and spiral arms.
Current usage metrics show cumulative count of Article Views (full-text article views including HTML views, PDF and ePub downloads, according to the available data) and Abstracts Views on Vision4Press platform.
Data correspond to usage on the plateform after 2015. The current usage metrics is available 48-96 hours after online publication and is updated daily on week days.
Initial download of the metrics may take a while.