Fig. 16
Download original image
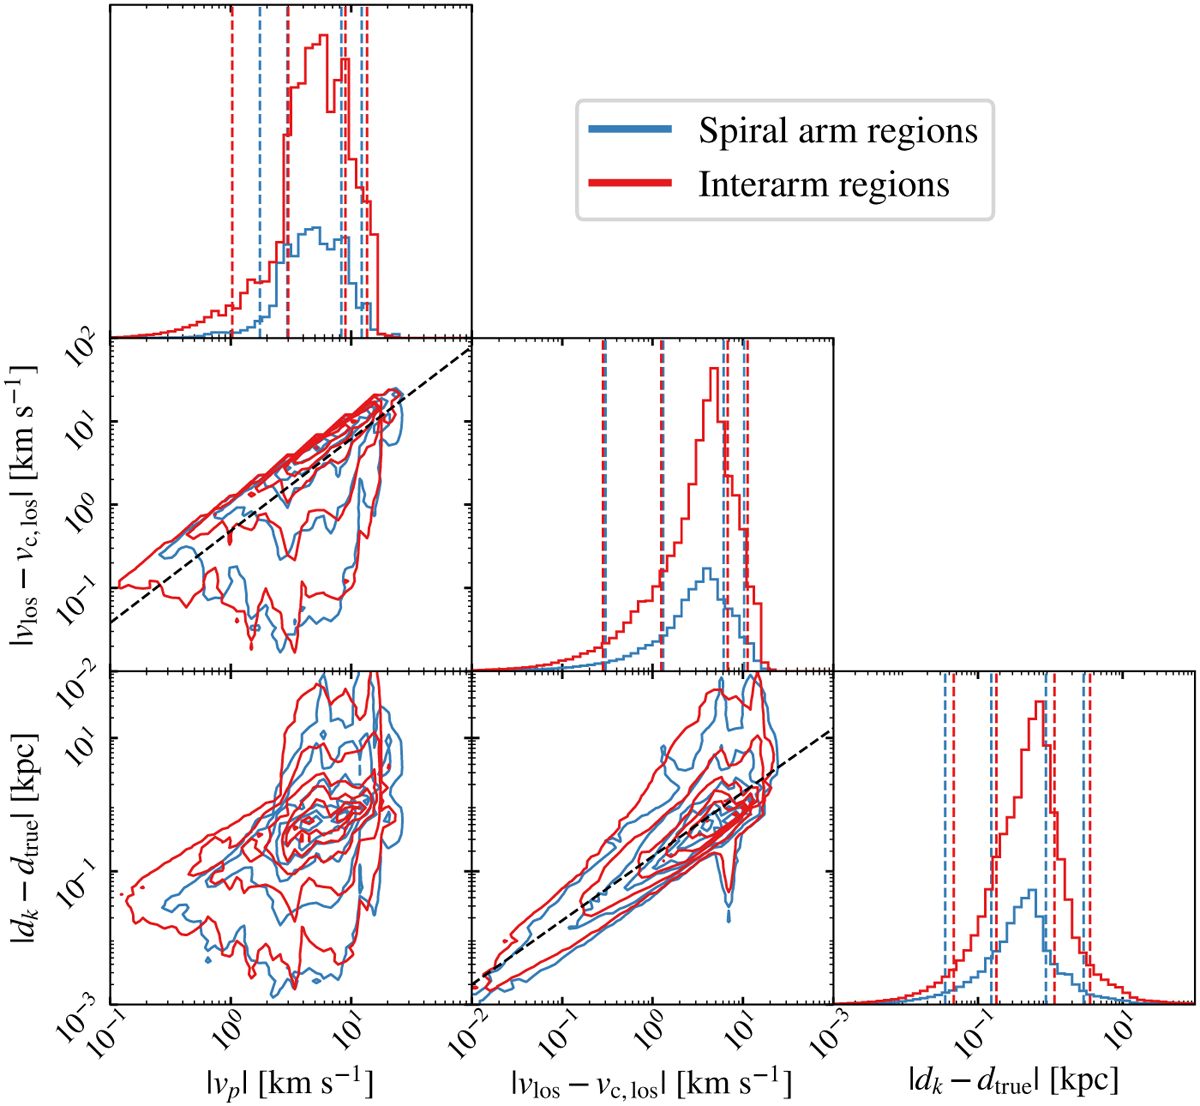
Distributions of the peculiar motions |vp|, LOS velocity difference from circular motion |vlos − vc,losI, and the difference between the kinematic and true distance |dk − dtrue|. The dashed vertical lines on the histograms indicate the 5%, 20%, 80% and 95% percentiles of the distributions. There is a power-law correlation between the peculiar velocity and LOS velocity deviation of slope α = 1.1 (middle-left plot). Similarly, there is a power-law correlation between the LOS deviations from circular velocity and the resulting distance error (bottom-middle plot) with a slope α = 0.94.
Current usage metrics show cumulative count of Article Views (full-text article views including HTML views, PDF and ePub downloads, according to the available data) and Abstracts Views on Vision4Press platform.
Data correspond to usage on the plateform after 2015. The current usage metrics is available 48-96 hours after online publication and is updated daily on week days.
Initial download of the metrics may take a while.