Open Access
Fig. 14
Download original image
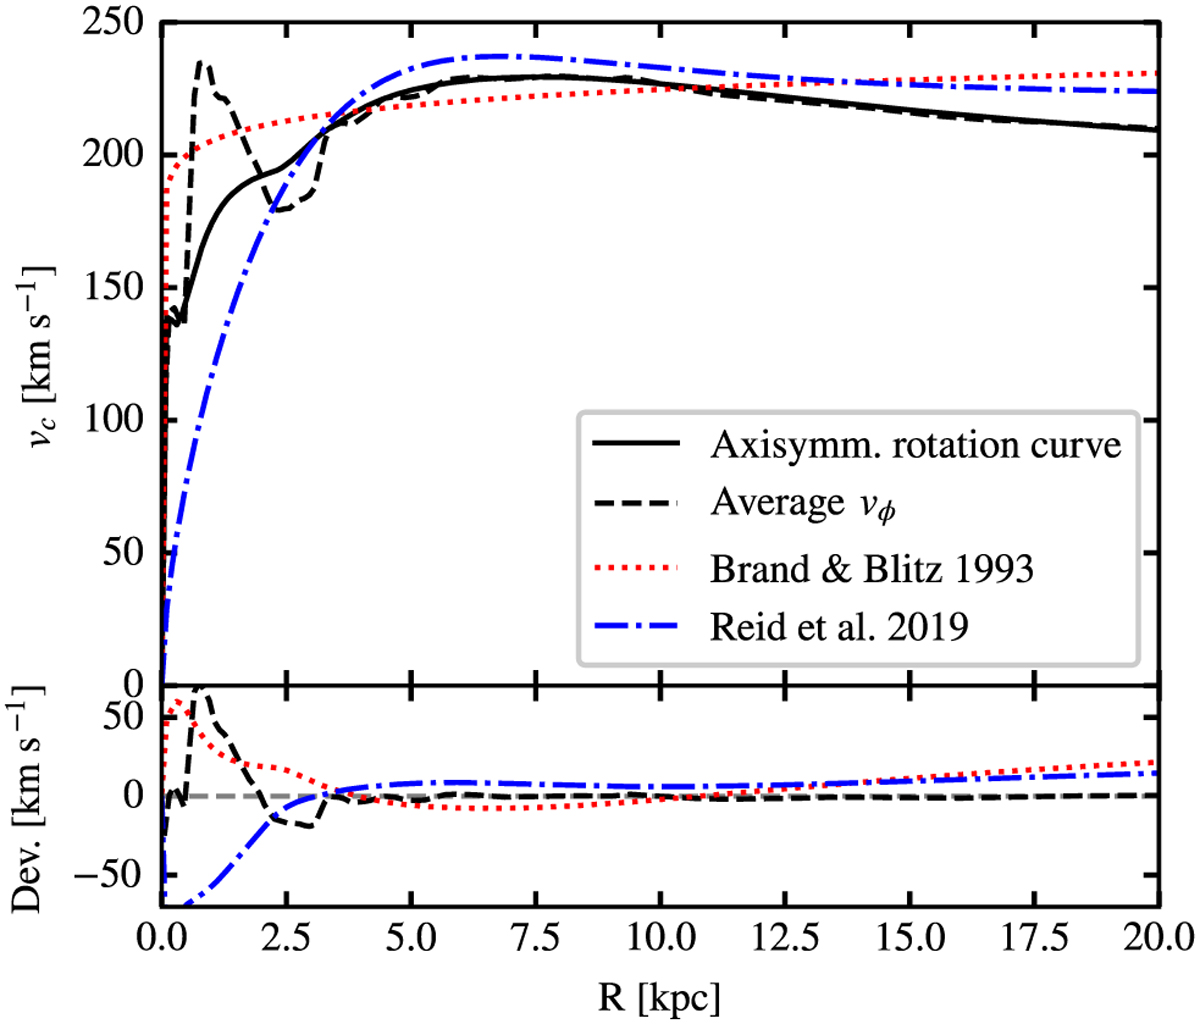
Comparison of rotation curve against the average azimuthal velocity (black solid and dashed line respectively). The red and blue lines are the rotation curve from Brand & Blitz (1993) and Reid et al. (2019).
Current usage metrics show cumulative count of Article Views (full-text article views including HTML views, PDF and ePub downloads, according to the available data) and Abstracts Views on Vision4Press platform.
Data correspond to usage on the plateform after 2015. The current usage metrics is available 48-96 hours after online publication and is updated daily on week days.
Initial download of the metrics may take a while.