Fig. 10
Download original image
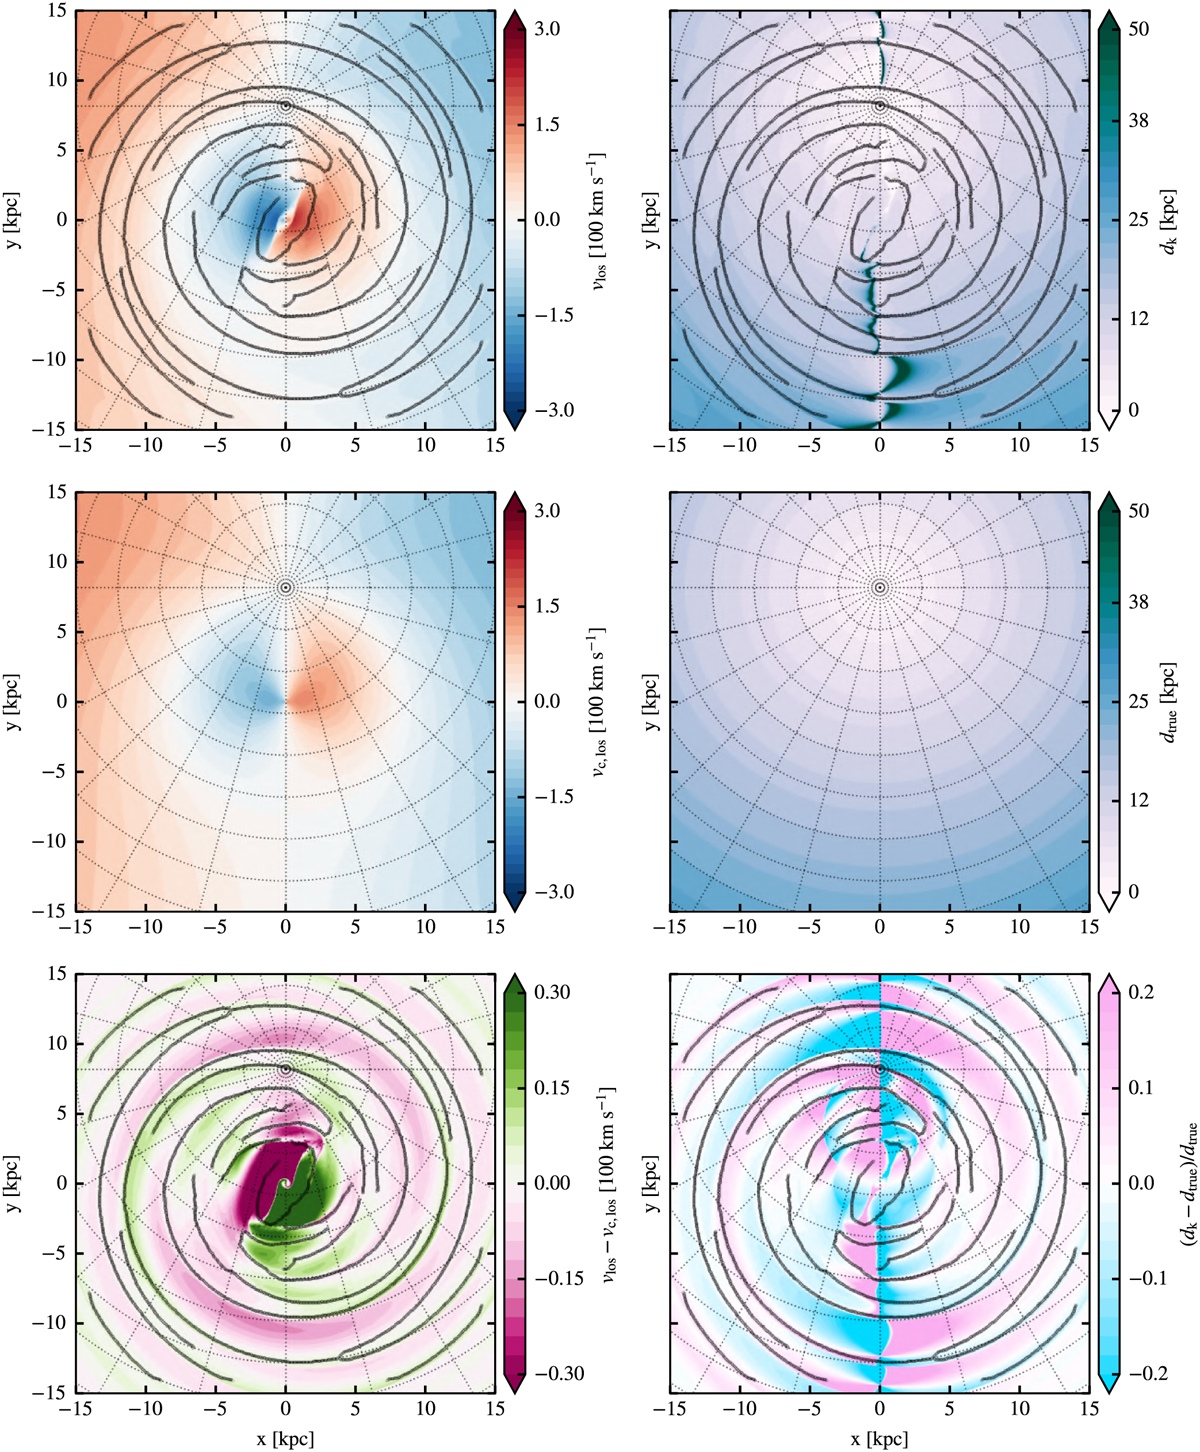
Kinematic distance uncertainties at different positions in the disk. The left column presents the LOS velocity map of the simulation and the comparison to the equivalent if the gas follows circular orbits. The top plot illustrates LOS velocity map of the simulation. Similarly, the middle plot shows the map of the LOS velocity derived from the base axisymmetric potential. The last plot shows the difference between simulation and axisymmetric LOS velocities; top plot minus the middle plot. The right column shows the estimated and real distance maps in the simulation. The black lines indicate the spiral arm pattern extracted with FILFINDER. The top plot shows the kinematic distance maps as estimated with Eq. (24). The middle plot is the map of the true distances to the gas cells. The relative error between the kinematic and true distance is shown in the bottom plot.
Current usage metrics show cumulative count of Article Views (full-text article views including HTML views, PDF and ePub downloads, according to the available data) and Abstracts Views on Vision4Press platform.
Data correspond to usage on the plateform after 2015. The current usage metrics is available 48-96 hours after online publication and is updated daily on week days.
Initial download of the metrics may take a while.