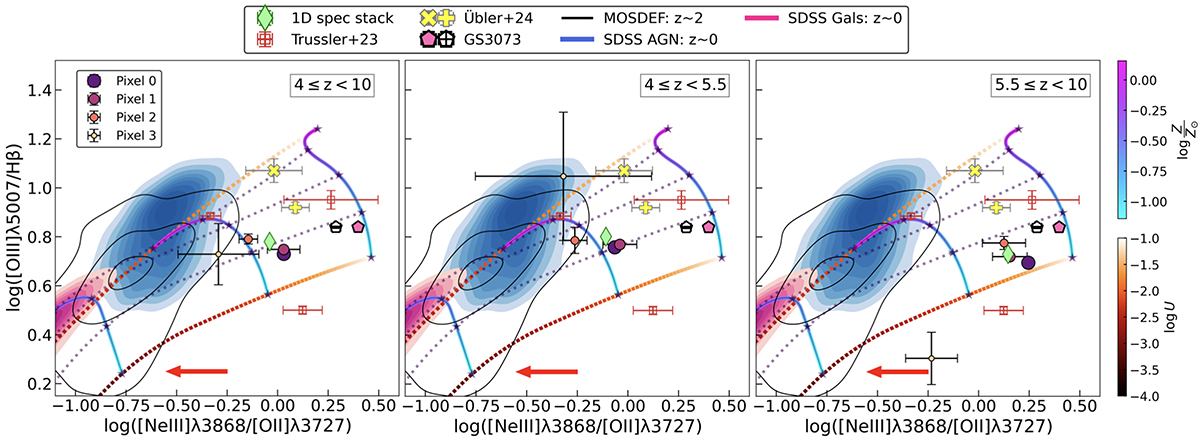
Fig. 5.
Download original image
[O III]λ5007/Hβ–[Ne III]λ3869/[O II]λ3727 line ratio diagram for the stacked samples. For comparison, we show z ∼ 0 SDSS AGNs (galaxies) as a blue (pink) colour map with contours, z ∼ 2 MOSDEF galaxies and AGNs (black contours), SMACS 06355, 10612, and 04590 (red squares; Trussler et al. 2023; the left-most square of the three is 06355, the type-II AGN identified by Brinchmann 2023), the type-I AGN host GS 3073 at z = 5.55 (filled and hollow pentagon, the latter estimating the flux of [Ne III]λ3869 based on the Case B assumption modulated by the median dust attenuation; Ji, in prep.), and the host galaxy of the z = 7.15 AGN type-I, ZS7 (yellow cross and plus symbol, depending on whether line fluxes are computed from the BLR location or the [O III] centroid, respectively; see Übler et al. 2024 for details). Contours represent the percentiles (from 15% to 95% for SDSS with a step of 10%, and 10%, 50%, and 90% for MOSDEF) of the number of objects in a sample. Spatially resolved ratios for our stacked samples of galaxies at 4 ≤ z < 10, 4 ≤ z < 5.5, and 5.5 ≤ z < 10 are plotted as solid circles in all three panels and are colour- and size coded based on the distance (in pixel) from the centre of the galaxy (i.e. pixel 0). Ratios for 1D stacked spectra of our samples are plotted as green diamonds. Overlaid are the star-formation photoionisation models of Gutkin et al. (2016) at hydrogen densities of log n[cm−3] = 2.0. The dotted and solid coloured lines show the variation of the ionisation parameter at fixed metallicity and the variation of metallicity at fixed ionisation parameter, respectively (colour scales on the right-hand side of the figure). With the spectral resolution of the prism, we measure a blend of [Ne III]λ3869, He Iλ3889, Hη, and Hζ; the red horizontal arrow at the bottom of each panel represents the maximum correction for [Ne III]λ3869/([Ne III]λ3869+He Iλ3889+Hζ+Hη) of ≈0.3 dex (see Sect. 3.2). This correction applies only to our data, and to GS 3073; all other data in the figure have sufficient spectral resolution to de-blend [Ne III]λ3869.
Current usage metrics show cumulative count of Article Views (full-text article views including HTML views, PDF and ePub downloads, according to the available data) and Abstracts Views on Vision4Press platform.
Data correspond to usage on the plateform after 2015. The current usage metrics is available 48-96 hours after online publication and is updated daily on week days.
Initial download of the metrics may take a while.