Fig. 4.

Download original image
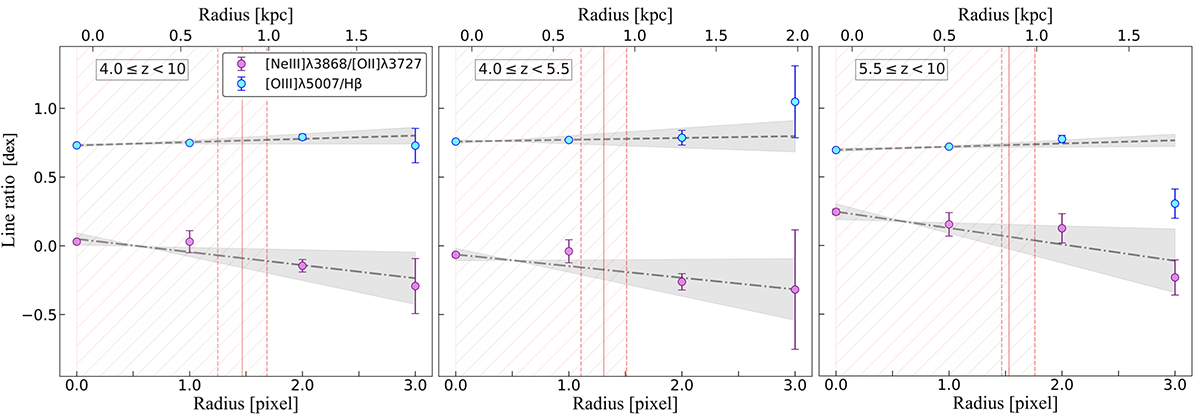
Averaged radial profiles of line ratios from the 2D stacked spectra at different redshift ranges. Cyan (violet) dots mark the logarithm of the [O III]λ5007/Hβ ([Ne III]λ3869/[O II]λ3727) ratio as a function of radius expressed in pixels (pixel 0 is the centre of the galaxy). The left panel show the results stacking all galaxies at 4 ≤ z < 10; the central panel stacking all galaxies at 4 ≤ z < 5.5; the right panel stacking all galaxies at 5.5 ≤ z < 10. The fit for the [O III]λ5007/Hβ ([Ne III]λ3869/[O II]λ3727) profile is shown as a dashed (dash-dotted) line with a shadowed region (3σ confidence interval). The orange vertical lines, along with the hatched region, mark the spatial resolution of the observations given by the 50th (solid), 16th (dashed left), and 84th (dashed right) percentiles of the distribution of the PSF size computed from the redshift distribution of galaxies in each sample. For each panel, the top x-axis is computed considering the median redshift of each sample, that is, z = 5.5 for the total stack, z = 4.7 for the low-z stack, and z = 6 for the high-z stack. These correspond to scales of 6.113 kpc/″, 6.614 kpc/″, and 5.832 kpc/″, respectively.
Current usage metrics show cumulative count of Article Views (full-text article views including HTML views, PDF and ePub downloads, according to the available data) and Abstracts Views on Vision4Press platform.
Data correspond to usage on the plateform after 2015. The current usage metrics is available 48-96 hours after online publication and is updated daily on week days.
Initial download of the metrics may take a while.


