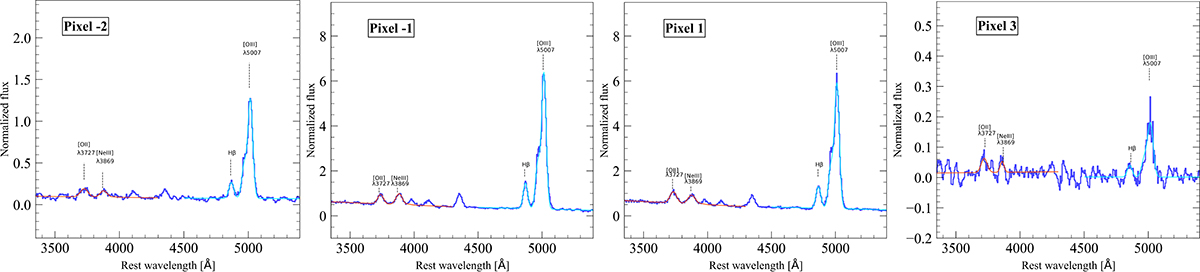
Fig. C.1.
Download original image
Stacked spectra using the NIRSpec/MSA prism spectra of galaxies at 4 ≤ z < 10 belonging to the JADES survey. Left panel: spectrum extracted from two pixel off central downwards (i.e. ∼1.2 kpc radius) of the 2D stacked spectrum. The cyan (violet) line is the best-fit function for the continuum and [O III]λ5007, Hβ ([O II]λ3727, [Ne III]λ3869) spectral lines. Central panel: spectrum extracted from one pixel off central downwards of the 2D stacked spectrum. Colour coding and labels are the same as left panel. Right panel: spectrum extracted from one pixel off central upwards of the 2D stacked spectrum. Colour coding and labels are the same as left panel.
Current usage metrics show cumulative count of Article Views (full-text article views including HTML views, PDF and ePub downloads, according to the available data) and Abstracts Views on Vision4Press platform.
Data correspond to usage on the plateform after 2015. The current usage metrics is available 48-96 hours after online publication and is updated daily on week days.
Initial download of the metrics may take a while.