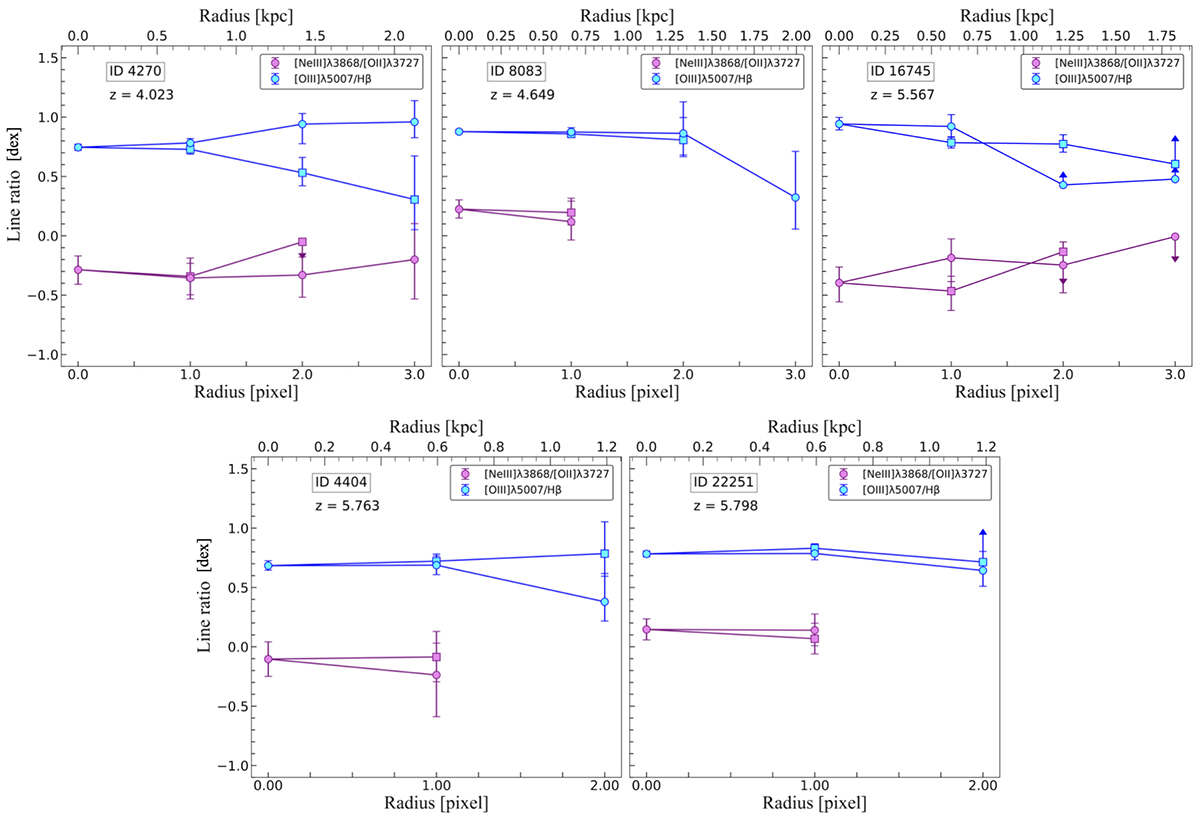
Fig. B.2.
Download original image
Five best cases of radial profiles of line ratios. Cyan (violet) dots mark the logarithm of [O III]λ5007/Hβ ([Ne III]λ3869/[O II]λ3727) ratio as a function of the radius expressed in pixels (pixel 0 is the centre of the galaxy). Different markers are used to discriminate between pixels above (squares) and below (circles) the central pixel 0 in the slit (see also Fig. 2b). The ID of each object and the redshift are specified in the top left corner of each plot.
Current usage metrics show cumulative count of Article Views (full-text article views including HTML views, PDF and ePub downloads, according to the available data) and Abstracts Views on Vision4Press platform.
Data correspond to usage on the plateform after 2015. The current usage metrics is available 48-96 hours after online publication and is updated daily on week days.
Initial download of the metrics may take a while.