Open Access
Fig. 4
Download original image
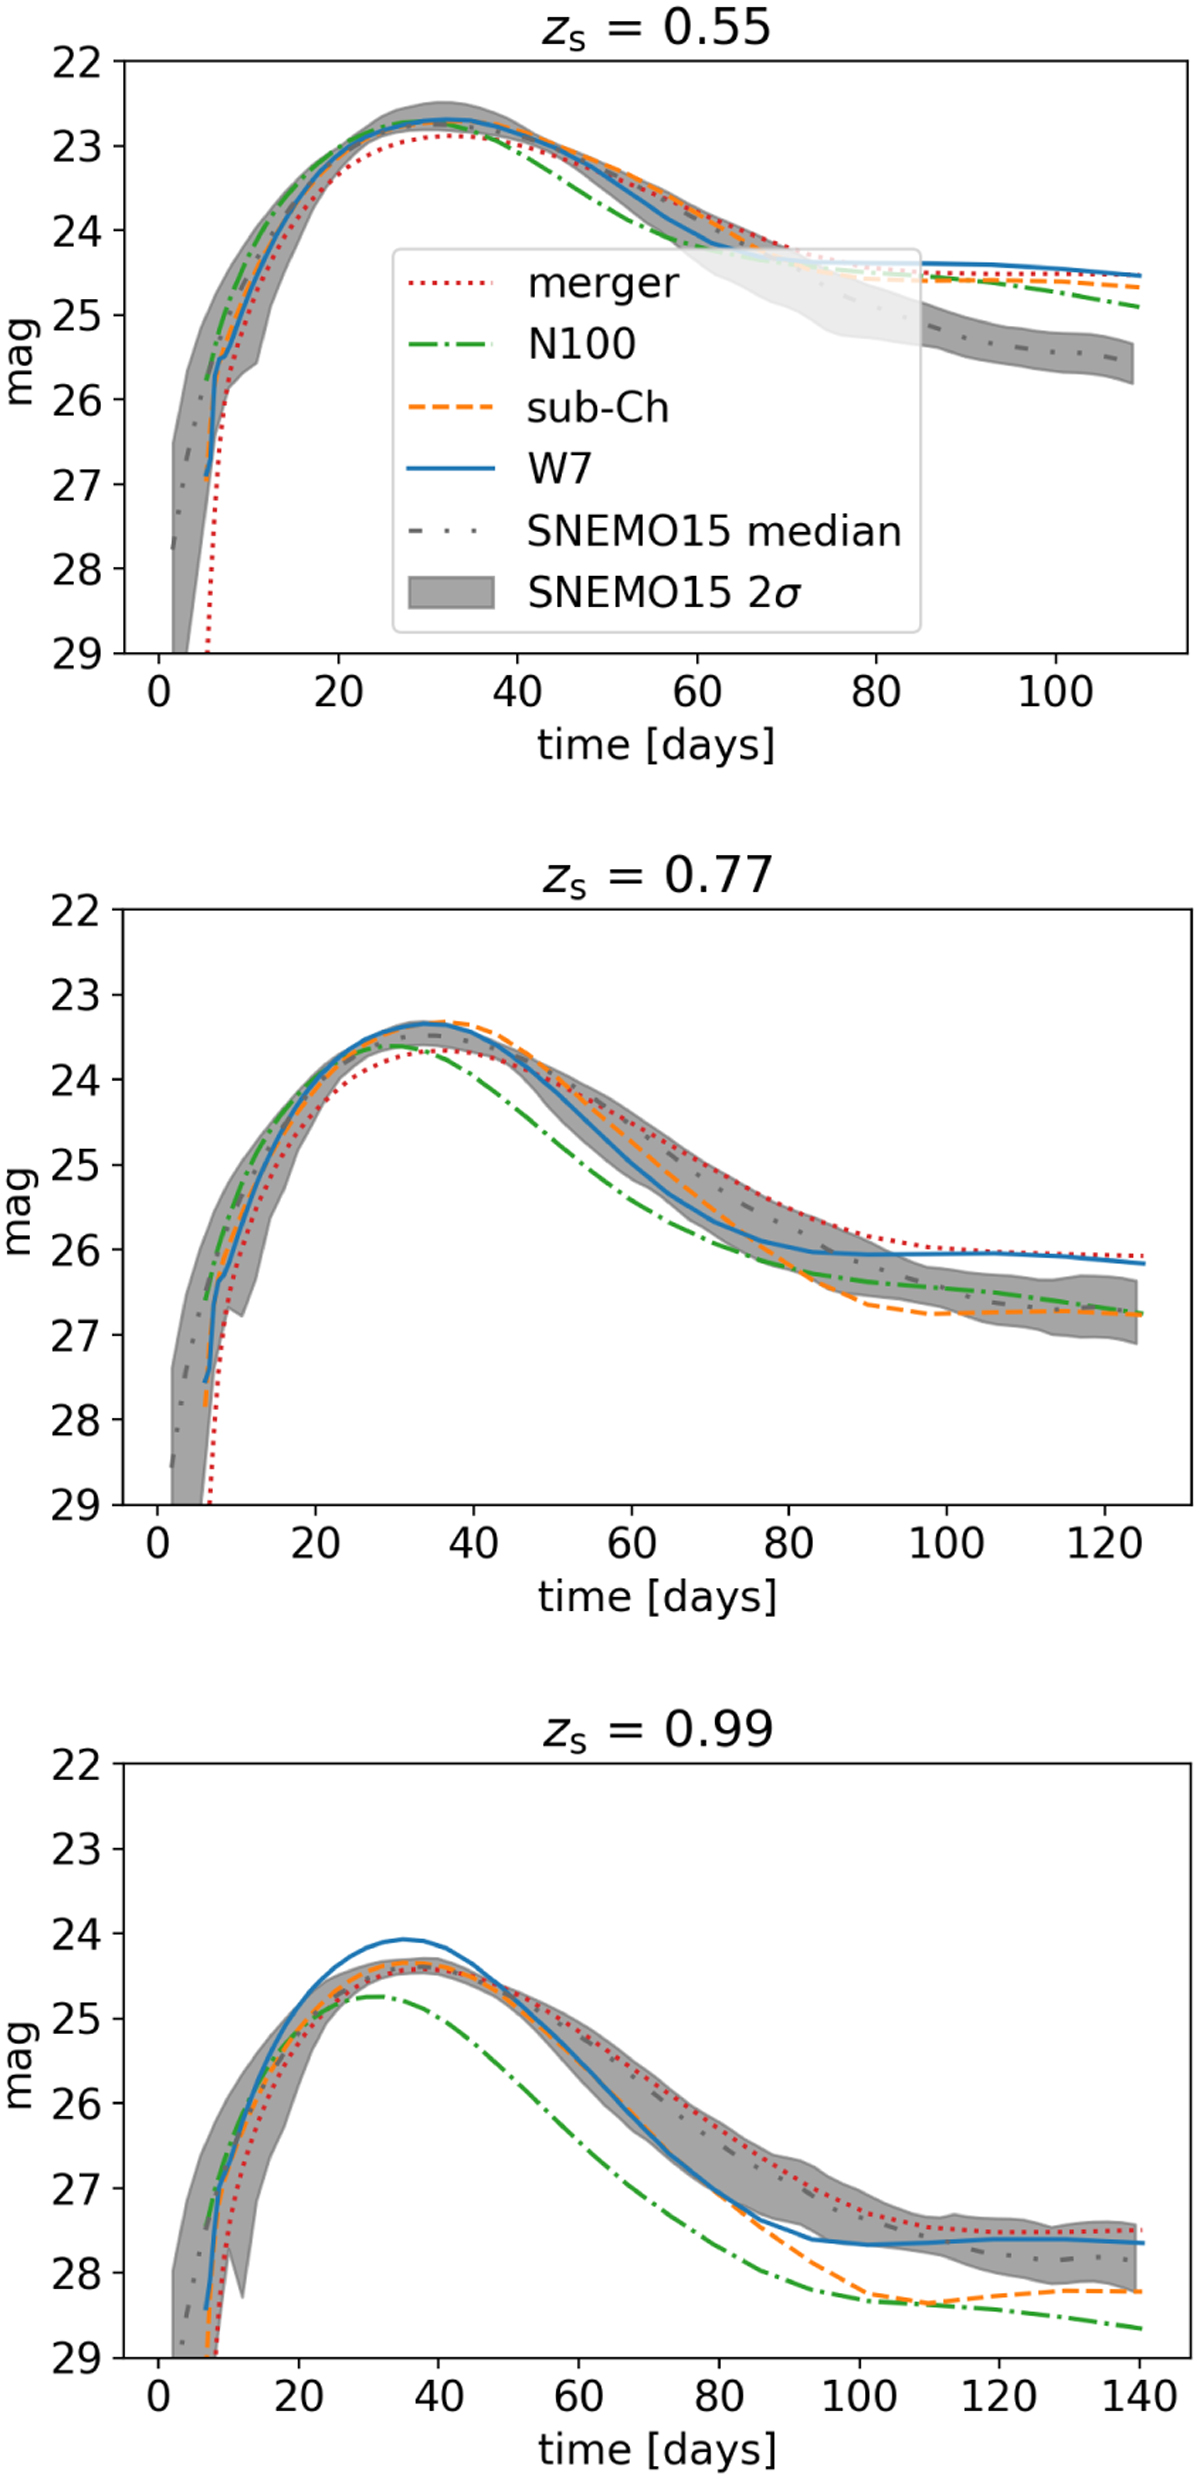
i band light curves for typical source redshifts of LSNe Ia as indicated on the top of each panel. We compare four theoretical models (merger, N100, sub-Ch, and W7) with the empirical SNEMO15 model.
Current usage metrics show cumulative count of Article Views (full-text article views including HTML views, PDF and ePub downloads, according to the available data) and Abstracts Views on Vision4Press platform.
Data correspond to usage on the plateform after 2015. The current usage metrics is available 48-96 hours after online publication and is updated daily on week days.
Initial download of the metrics may take a while.