Open Access
Fig. 2
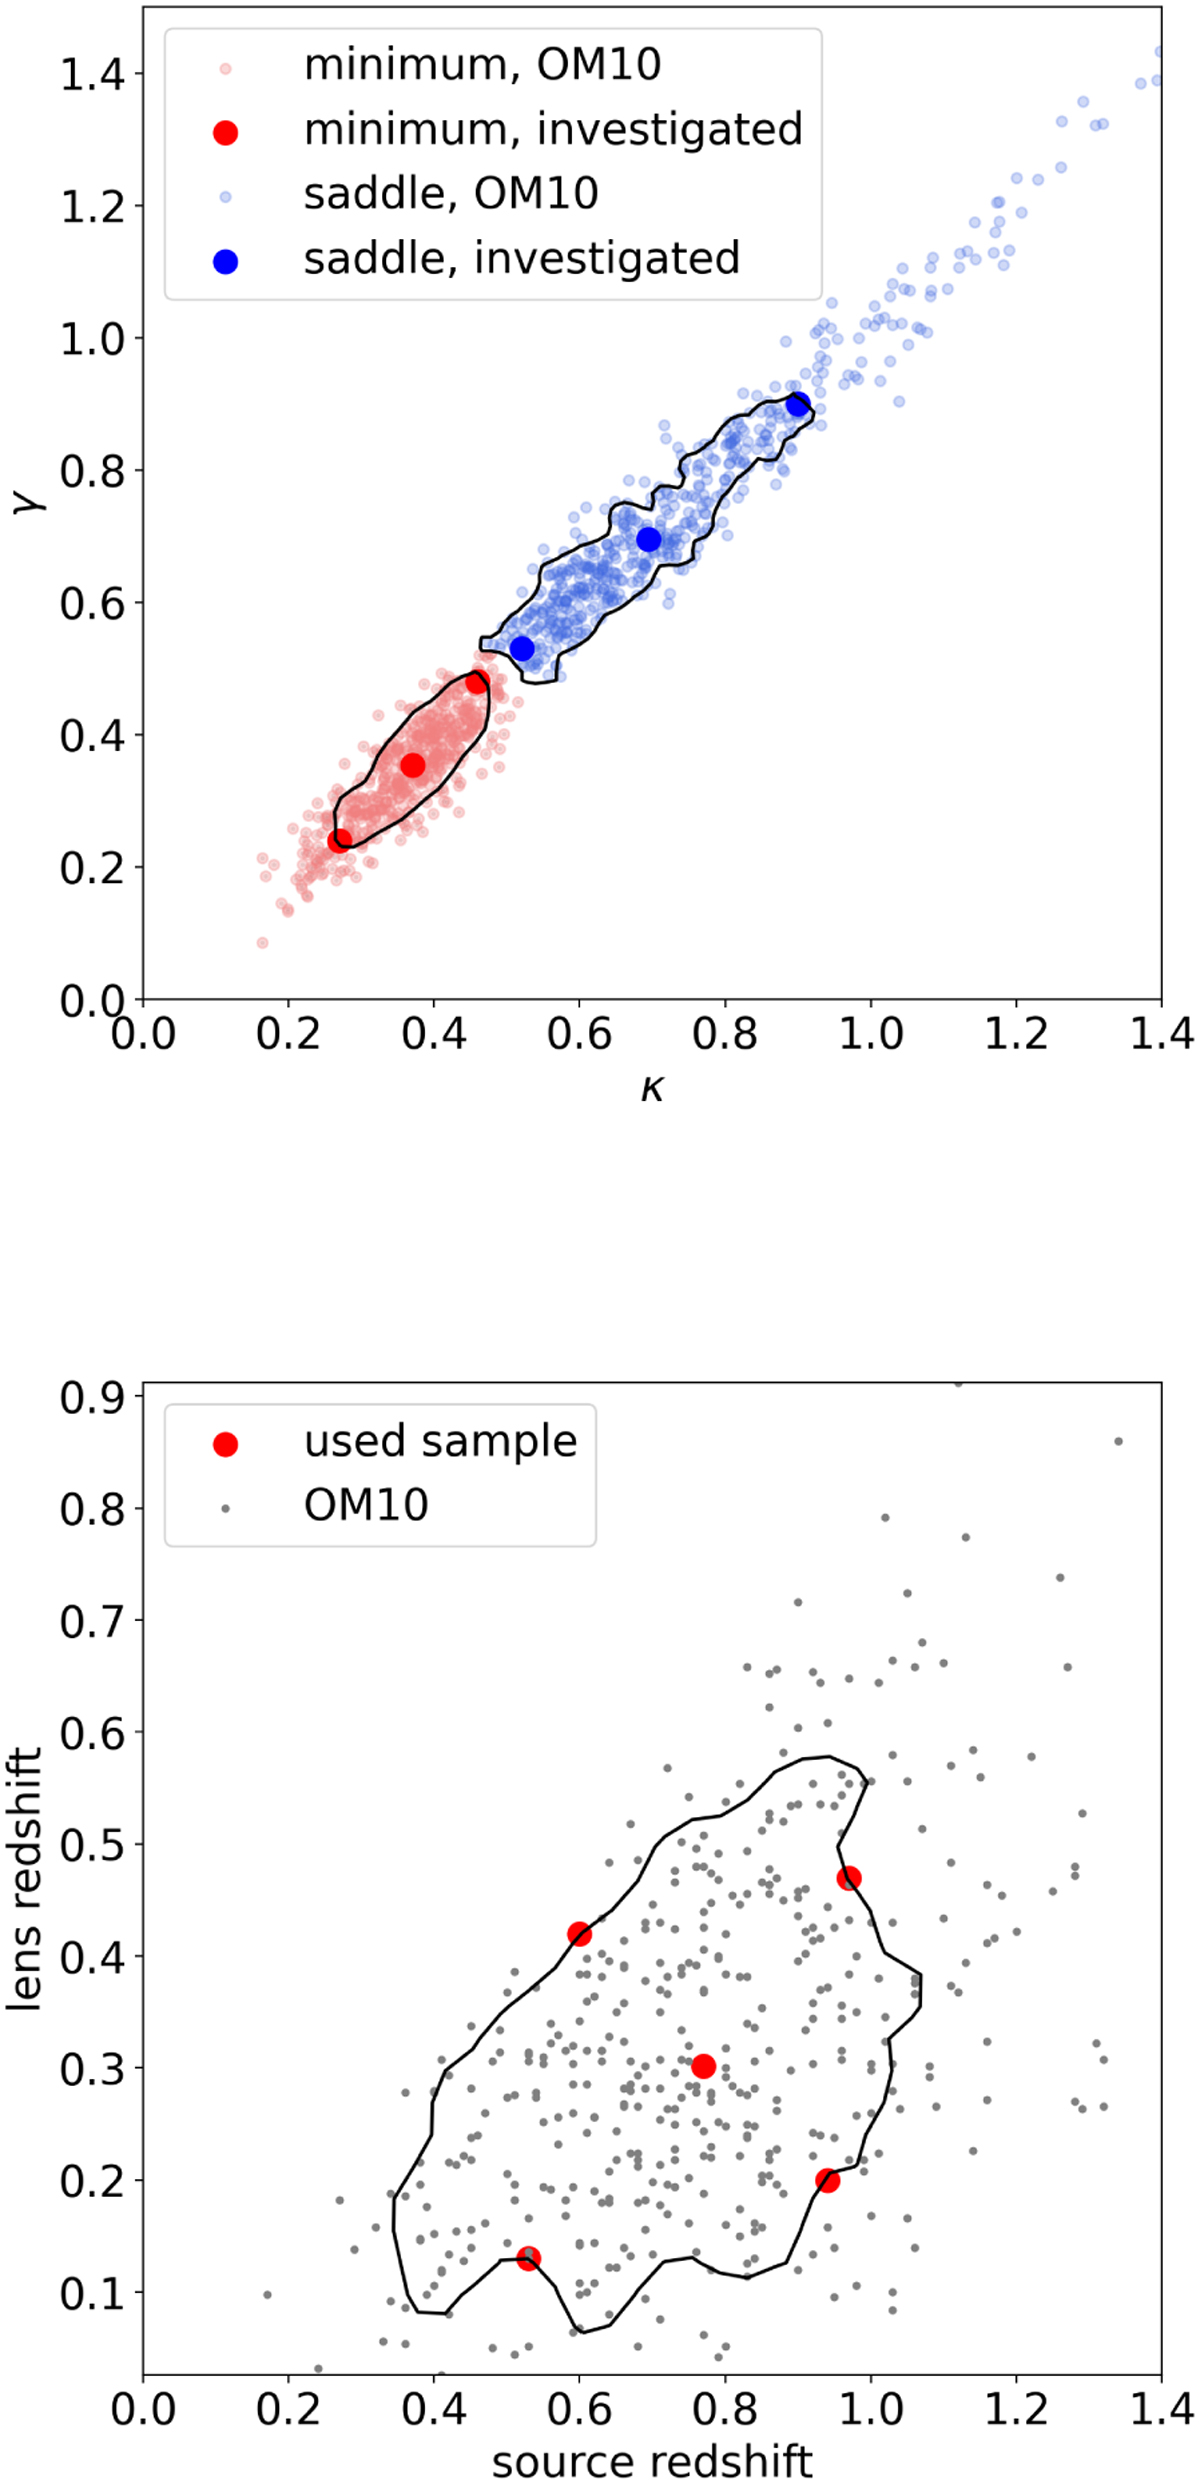
Download original image
Convergence κ and shear γ (upper panel), and source redshift zs and lens redshift zd (lower panel) used for the calculation of microlensed light curves drawn from the OM10 catalog. The black lines represent contours that enclose 68% of the LSN Ia systems in the OM10 catalog.
Current usage metrics show cumulative count of Article Views (full-text article views including HTML views, PDF and ePub downloads, according to the available data) and Abstracts Views on Vision4Press platform.
Data correspond to usage on the plateform after 2015. The current usage metrics is available 48-96 hours after online publication and is updated daily on week days.
Initial download of the metrics may take a while.