Fig. 8.
Download original image
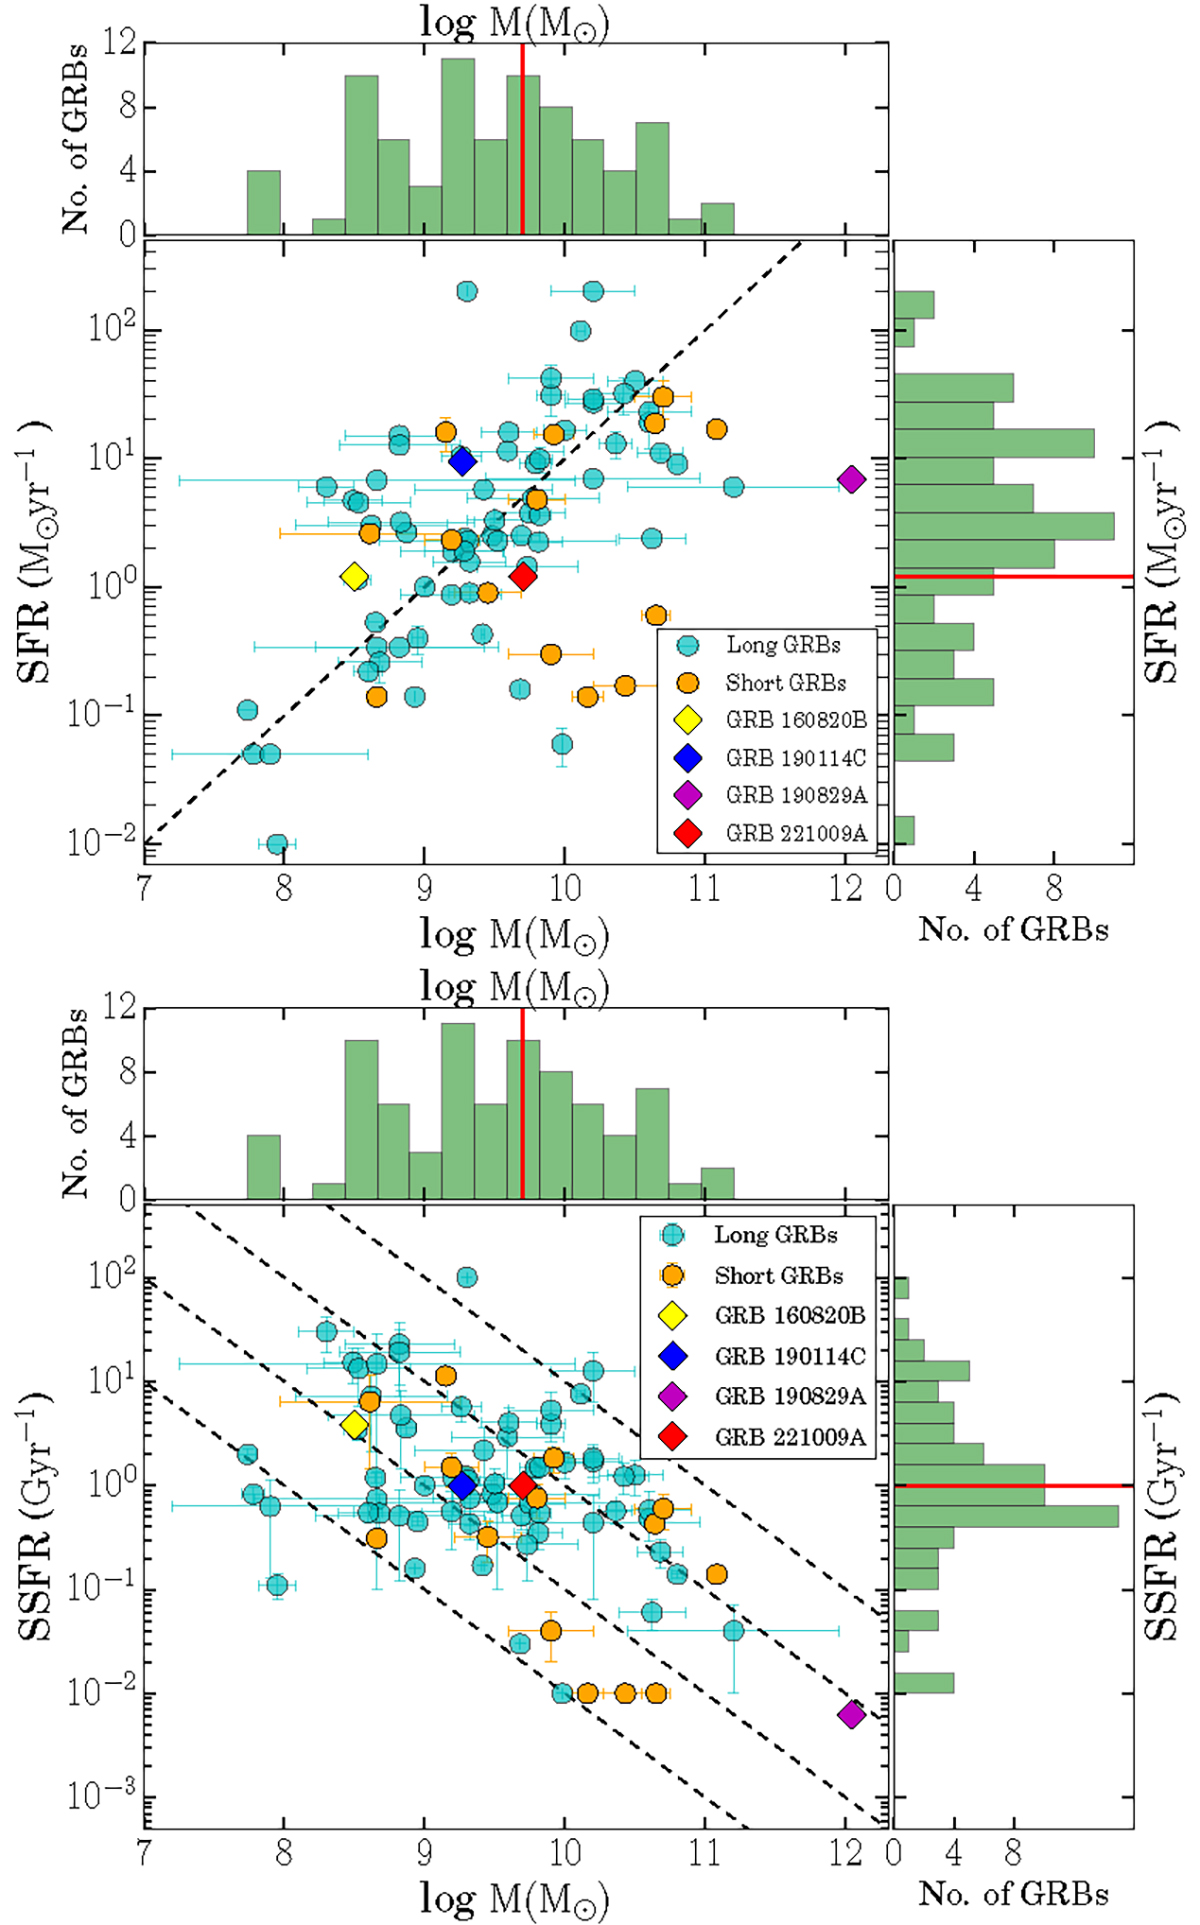
Host galaxy characteristics of TeV GRBs presented along with other well-studied lGRBs (shown with cyan circles) and sGRBs (shown using orange circles) to determine if TeV-detected GRBs require unique environments. Top panel: Distribution of host galaxy mass plotted against SFR, with the top X-axis and right side Y-axis representing the histogram of mass and SFR, respectively. The dashed black line represents an sSFR of 1 Gyr−1 Bottom panel: Distribution of host galaxy mass as a function of sSFR, with the top X-axis and right side Y-axis representing the histogram of mass and sSFR, respectively. In these histograms, the vertical red lines show the position of GRB 221009A. The position of GRB 221009A is marked using red diamonds in both figures.
Current usage metrics show cumulative count of Article Views (full-text article views including HTML views, PDF and ePub downloads, according to the available data) and Abstracts Views on Vision4Press platform.
Data correspond to usage on the plateform after 2015. The current usage metrics is available 48-96 hours after online publication and is updated daily on week days.
Initial download of the metrics may take a while.