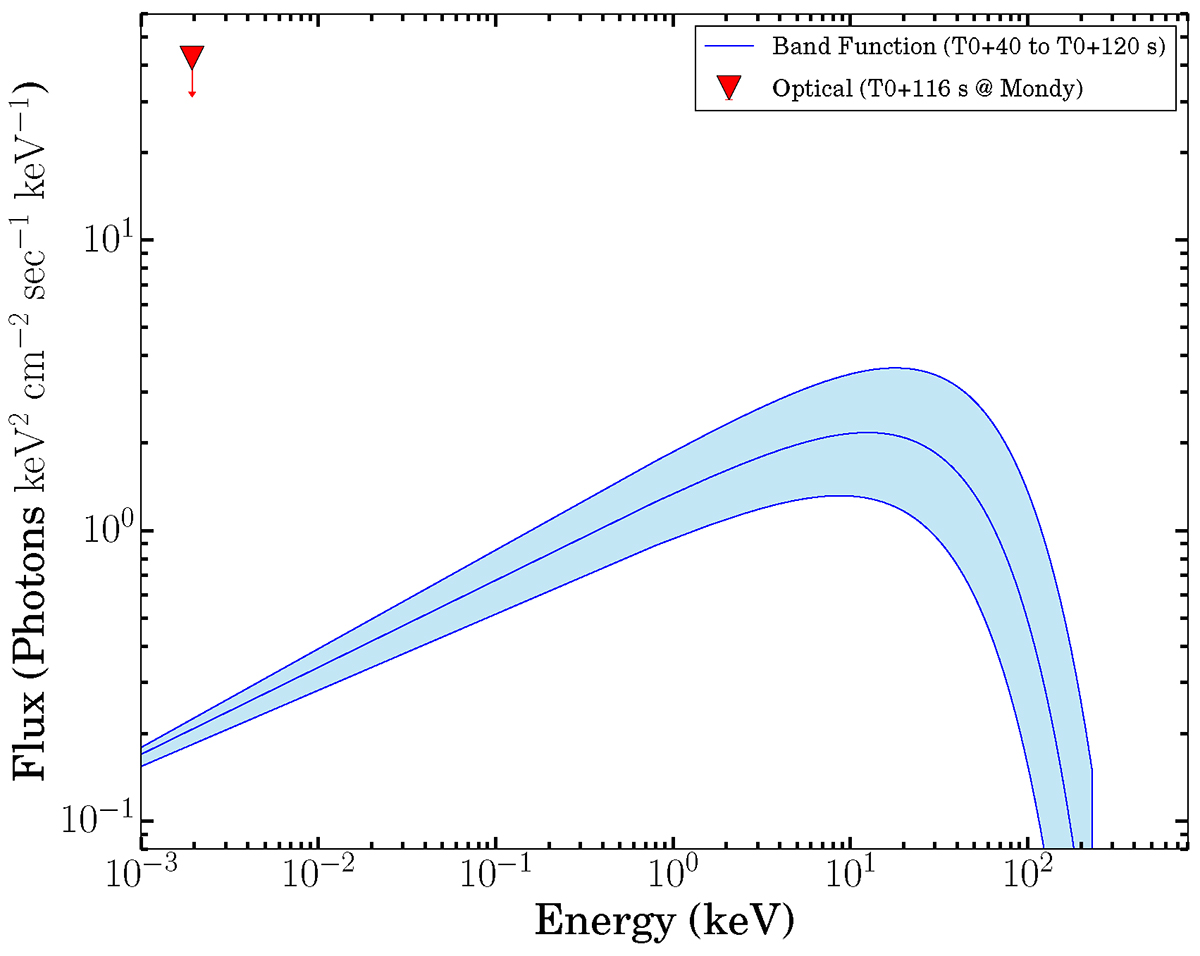
Fig. 7.
Download original image
Spectral energy distribution of prompt emission during the early optical observations of GRB 221009A taken with the all-sky camera at the Mondy telescope. The shaded blue region represents the uncertainty associated with the spectral parameters of the prompt emission. The Fermi spectrum (T0 +40 to T0 +120 s) during the Mondy observations, characterized by the best-fit Band function, is from Ror et al. (in prep.).
Current usage metrics show cumulative count of Article Views (full-text article views including HTML views, PDF and ePub downloads, according to the available data) and Abstracts Views on Vision4Press platform.
Data correspond to usage on the plateform after 2015. The current usage metrics is available 48-96 hours after online publication and is updated daily on week days.
Initial download of the metrics may take a while.