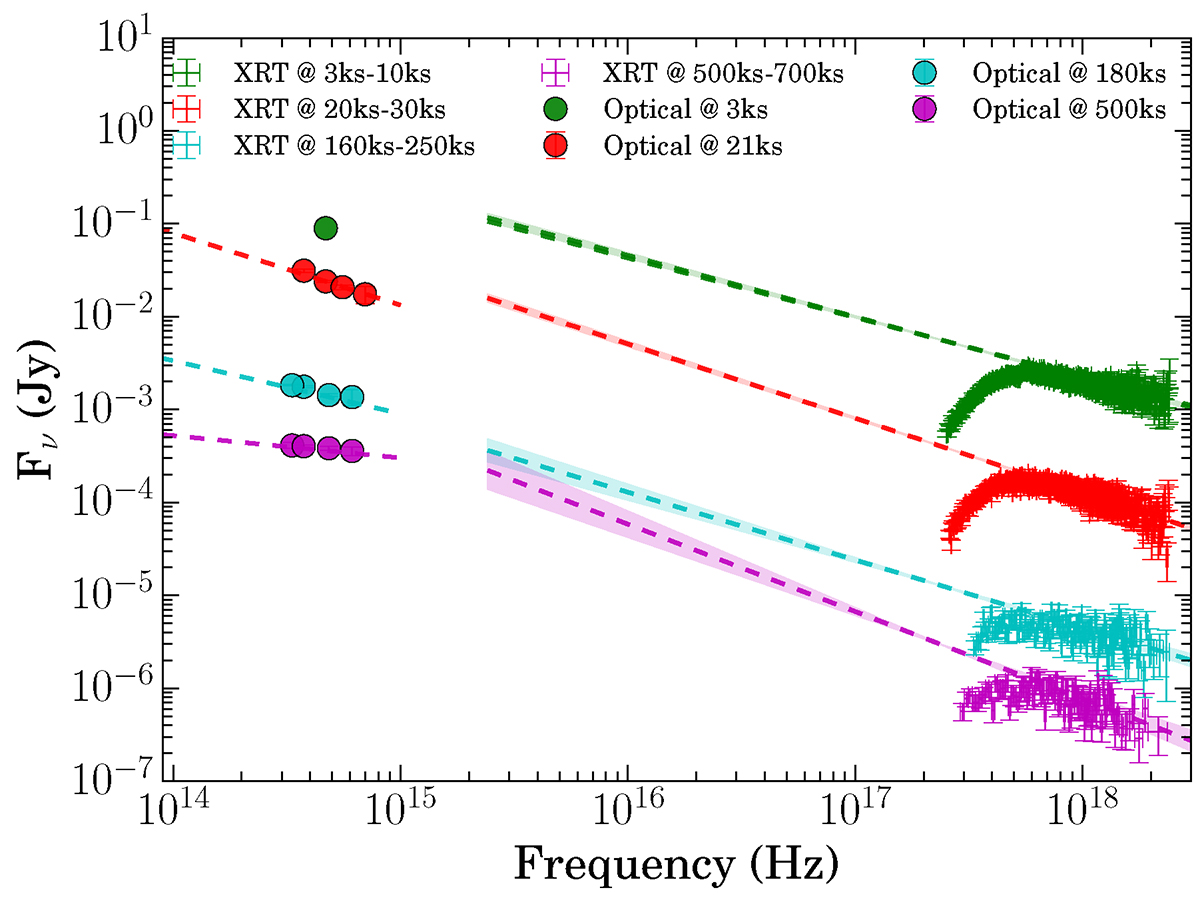
Fig. 6.
Download original image
Optical to X-ray SED corresponding to the time intervals shown by the color-coded vertical bands in the multiband afterglow light curves given in Figure 3. The dashed lines represent the power laws fitted to each spectrum, and values of indices obtained from the fitting are tabulated in Table 5. Optical observations shown here have been corrected for Galactic extinction.
Current usage metrics show cumulative count of Article Views (full-text article views including HTML views, PDF and ePub downloads, according to the available data) and Abstracts Views on Vision4Press platform.
Data correspond to usage on the plateform after 2015. The current usage metrics is available 48-96 hours after online publication and is updated daily on week days.
Initial download of the metrics may take a while.