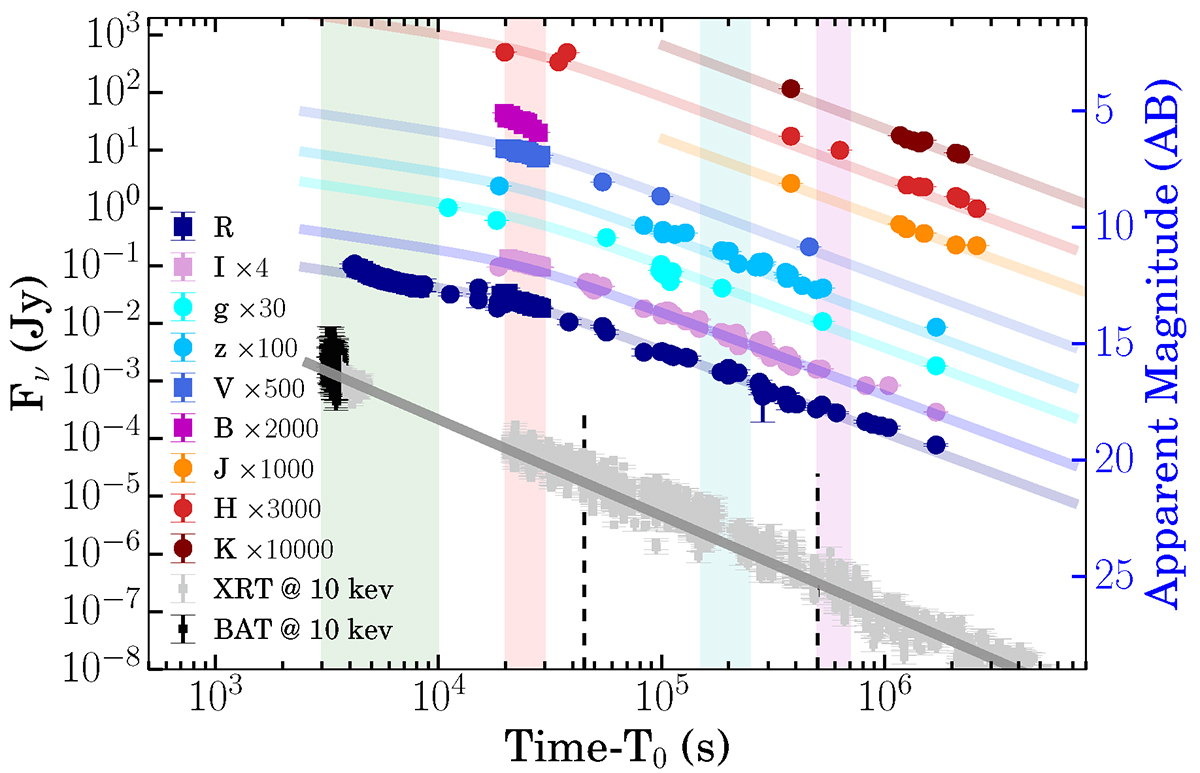
Fig. 5.
Download original image
Multiwavelength afterglow light curves of GRB 221009A. Optical data in various pass-bands has been scaled for clarity, as indicated by the legends in the lower-left corner. The data points in color-coded circles are those taken from the GCN circulars and other published articles, whereas those in Table A.1 are represented by color-coded squares. The solid lines overplotted on the observed data show the power laws fitted to the light curves, and the vertical black lines represent the segments in the XRT light curve that are separately fitted by a simple power law. The four colored regions denote the epochs of spectral energy distributions. The apparent magnitude is represented on the right-side Y-axis.
Current usage metrics show cumulative count of Article Views (full-text article views including HTML views, PDF and ePub downloads, according to the available data) and Abstracts Views on Vision4Press platform.
Data correspond to usage on the plateform after 2015. The current usage metrics is available 48-96 hours after online publication and is updated daily on week days.
Initial download of the metrics may take a while.