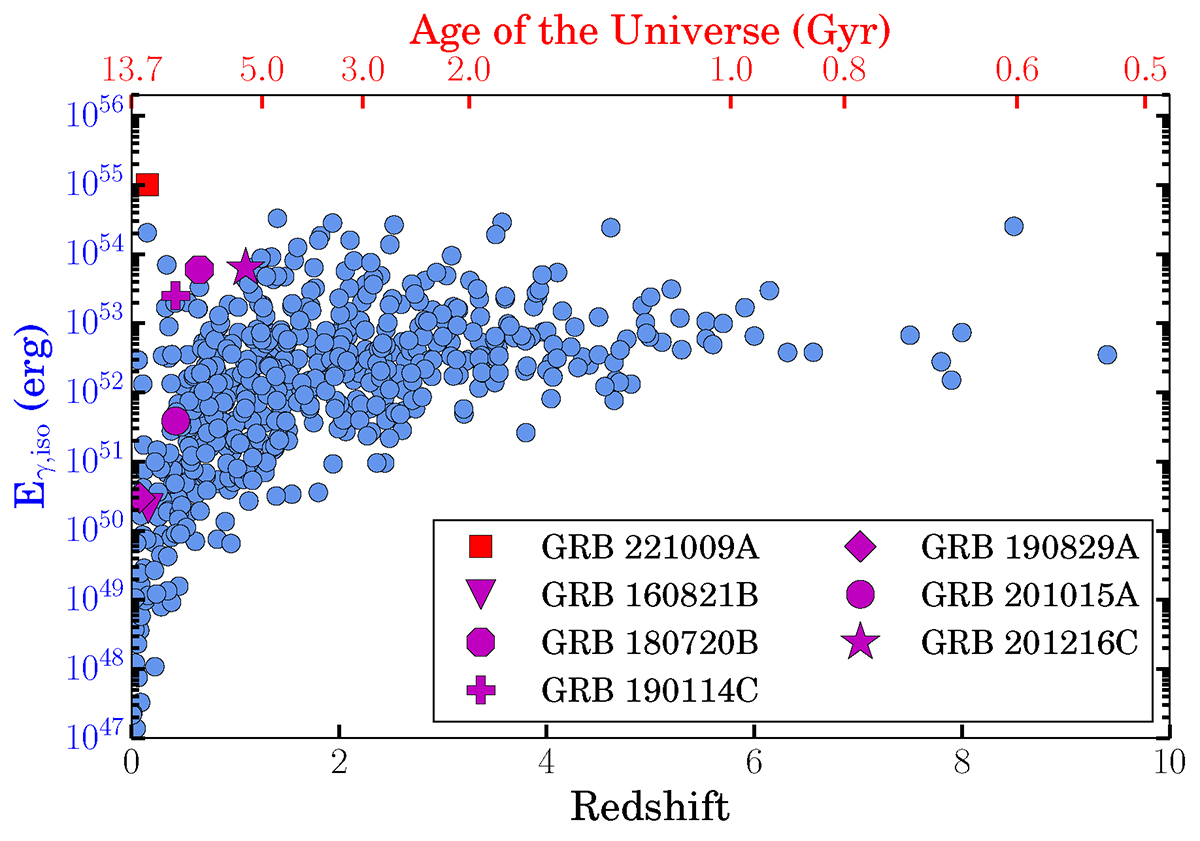
Fig. 4.
Download original image
Comparison of the relationship between the isotropic gamma-ray energy (Eγ, iso) distribution and the redshift (z) of GRB 221009A (red square) with other TeV-detected GRBs listed in Table 2. The background consists (blue circles) of a distribution of Eγ, iso for a sample of GRBs with a measured z, taken from Minaev & Pozanenko (2020). The upper X-axis represents the age of the universe in giga years, corresponding to the redshift values indicated on the lower X-axis.
Current usage metrics show cumulative count of Article Views (full-text article views including HTML views, PDF and ePub downloads, according to the available data) and Abstracts Views on Vision4Press platform.
Data correspond to usage on the plateform after 2015. The current usage metrics is available 48-96 hours after online publication and is updated daily on week days.
Initial download of the metrics may take a while.