Fig. 3.
Download original image
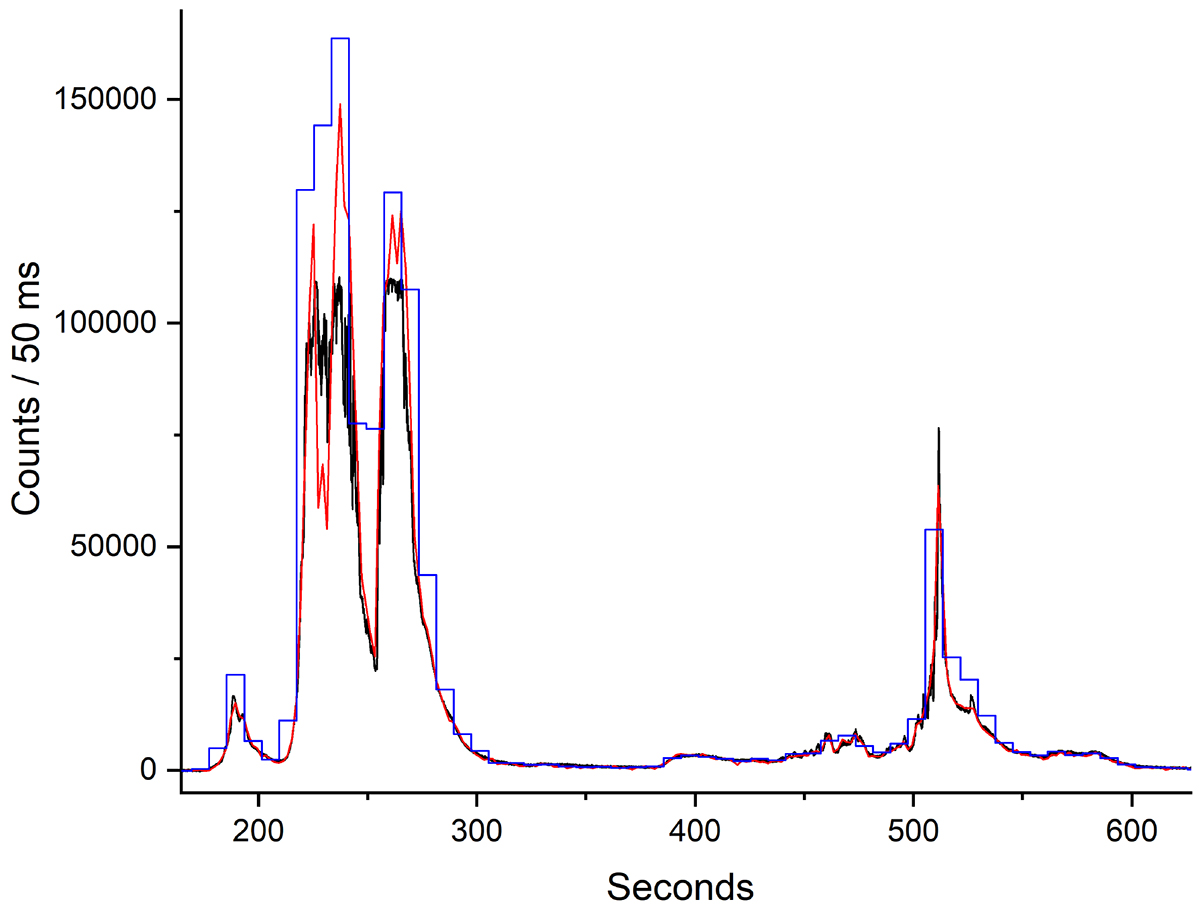
Light curve of the main episode of GRB 221009A prompt emission as observed from INTEGRAL/ACS (in count rate unit). In black, we represent the original data (saturated), the red line shows the model calibrated against the BepiColombo detector, and in blue we plot the restored light curves using the INTEGRAL/IBIS-VETO detector. Our earliest optical observations closely resemble the epoch of the precursor activity and are the earliest optical observations ever reported for this historic burst.
Current usage metrics show cumulative count of Article Views (full-text article views including HTML views, PDF and ePub downloads, according to the available data) and Abstracts Views on Vision4Press platform.
Data correspond to usage on the plateform after 2015. The current usage metrics is available 48-96 hours after online publication and is updated daily on week days.
Initial download of the metrics may take a while.