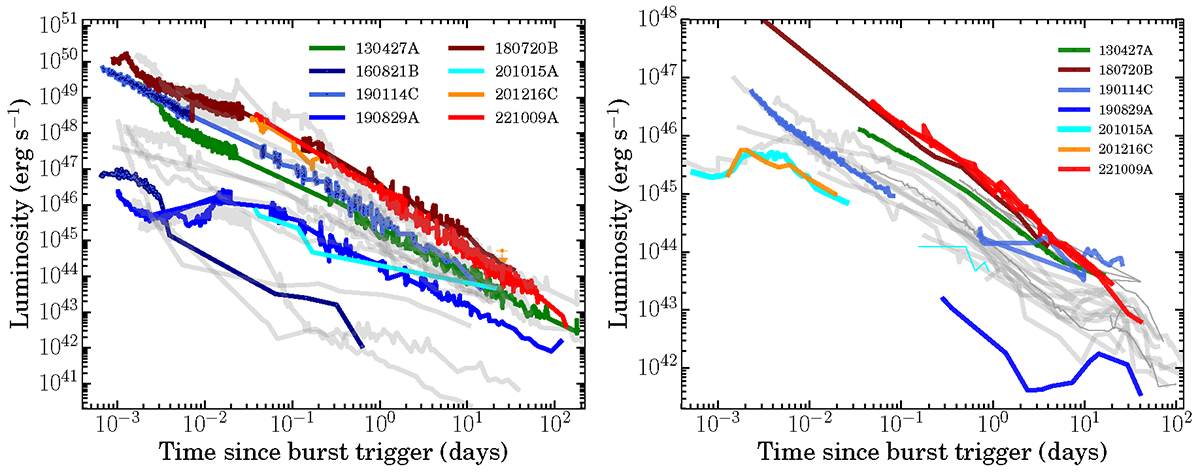
Fig. A.2.
Download original image
Comparison of XRT and R-band Luminosity Light Curves of TeV-detected and Supernova-associated GRBs. Top: Swift-XRT luminosity light curve of TeV-detected GRBs (plotted in various colors) and nearby GRBs that have observed supernova emission (gray color in the background). To compare the brightness of GRB 130427A and GRB 221009A, GRB 130427A is also added. Bottom: R-band luminosity light curves of TeV-detected GRBs are similarly plotted with the supernovae-detected GRBs in the background.
Current usage metrics show cumulative count of Article Views (full-text article views including HTML views, PDF and ePub downloads, according to the available data) and Abstracts Views on Vision4Press platform.
Data correspond to usage on the plateform after 2015. The current usage metrics is available 48-96 hours after online publication and is updated daily on week days.
Initial download of the metrics may take a while.