Fig. 1.
Download original image
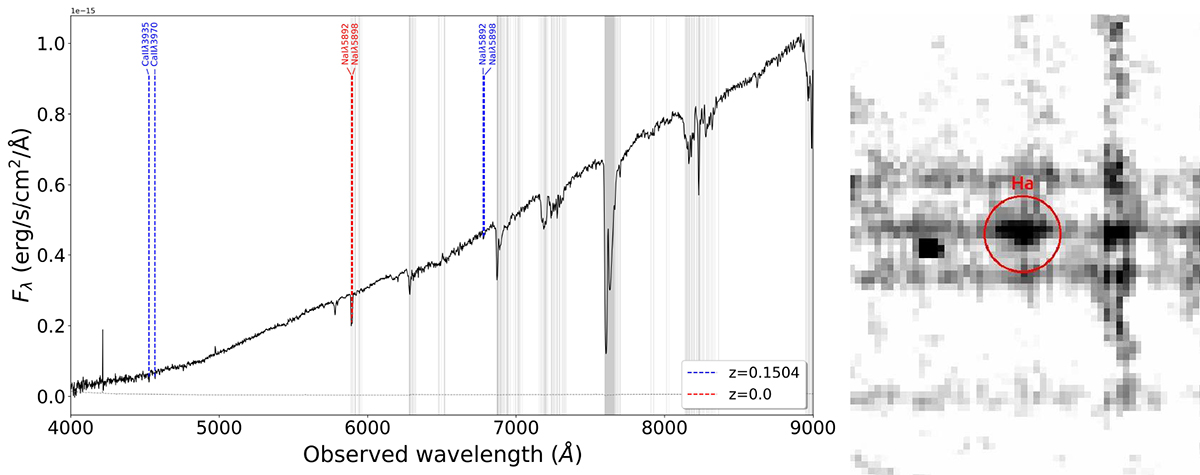
Line identification of GRB 221009A. Left. GRB 221009A afterglow optical spectrum as observed by the 10.4 m GTC(+OSIRIS) 8.6 hours post burst. The signal is represented by the solid black line, and the error spectrum is indicated with the gray dotted line. Vertical gray lines and bands represent the regions affected by telluric absorption. Identified lines at a given redshift are marked following the color code shown in the plot. Right. Hα line observed by the 6m BTA(+SCORPIO-2) on October 18, 2022. With the analysis of these early spectra, we established a redshift of GRB 221009A to be 0.151.
Current usage metrics show cumulative count of Article Views (full-text article views including HTML views, PDF and ePub downloads, according to the available data) and Abstracts Views on Vision4Press platform.
Data correspond to usage on the plateform after 2015. The current usage metrics is available 48-96 hours after online publication and is updated daily on week days.
Initial download of the metrics may take a while.