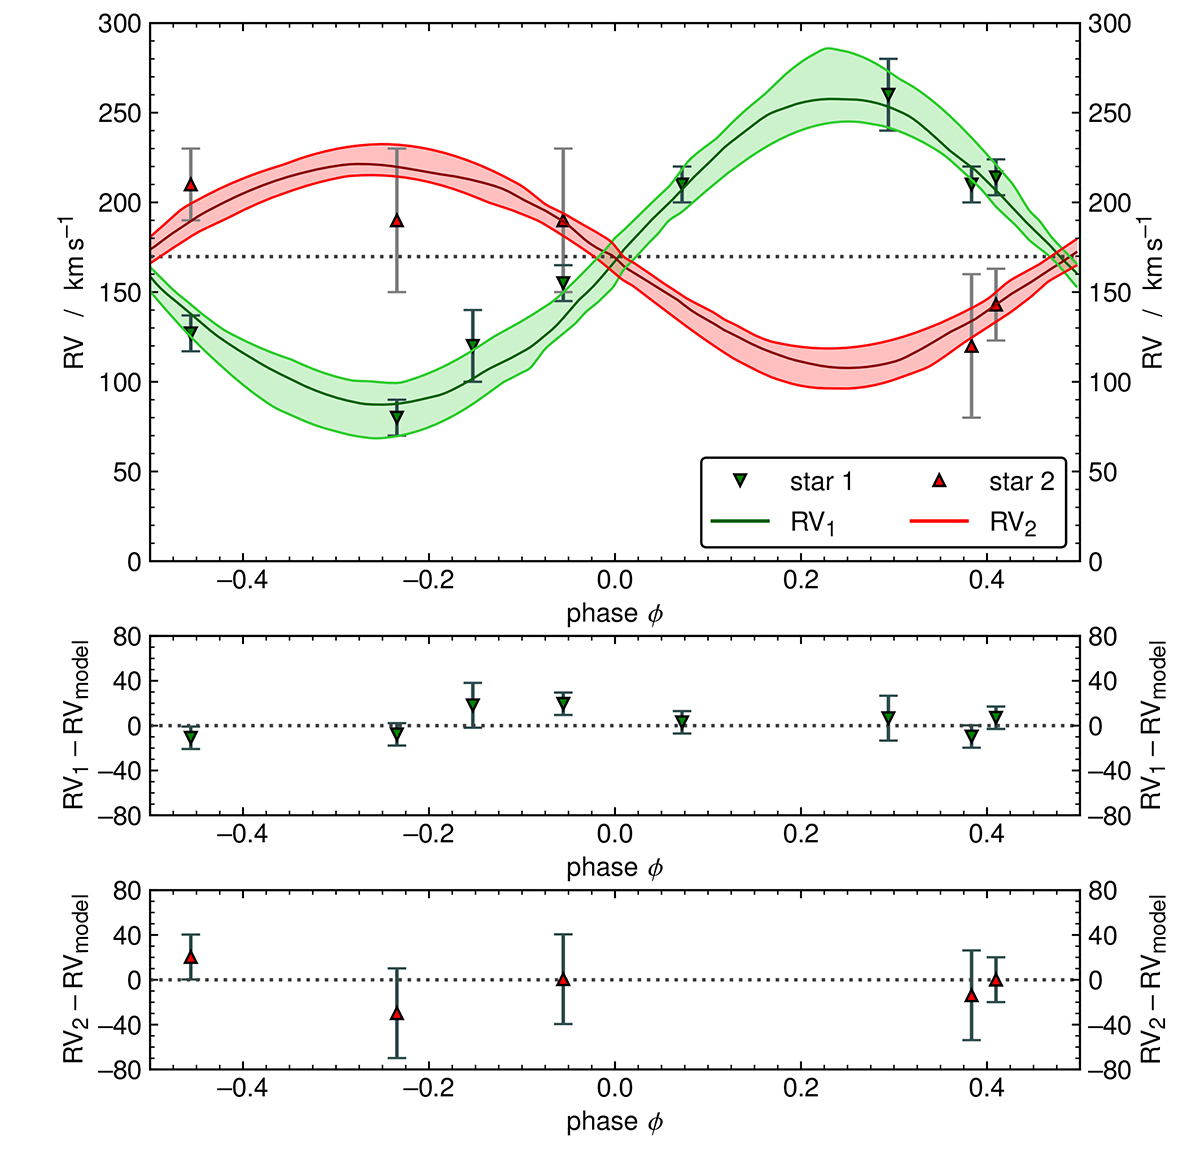
Fig. B.1.
Download original image
RVs of both components in 2dFS 2553 as a function of phase. Upper panel: Observed (triangles) and synthetic (solid lines) RV curves of the primary (green) and secondary (red) as obtained with the PHOEBE code. The dashed black line indicates the systemic velocity vγ. Middle panel: Residuals of the primary’s RVs after subtraction of the model. Lower panel: Residuals of the secondary’s RVs after subtraction of the model.
Current usage metrics show cumulative count of Article Views (full-text article views including HTML views, PDF and ePub downloads, according to the available data) and Abstracts Views on Vision4Press platform.
Data correspond to usage on the plateform after 2015. The current usage metrics is available 48-96 hours after online publication and is updated daily on week days.
Initial download of the metrics may take a while.