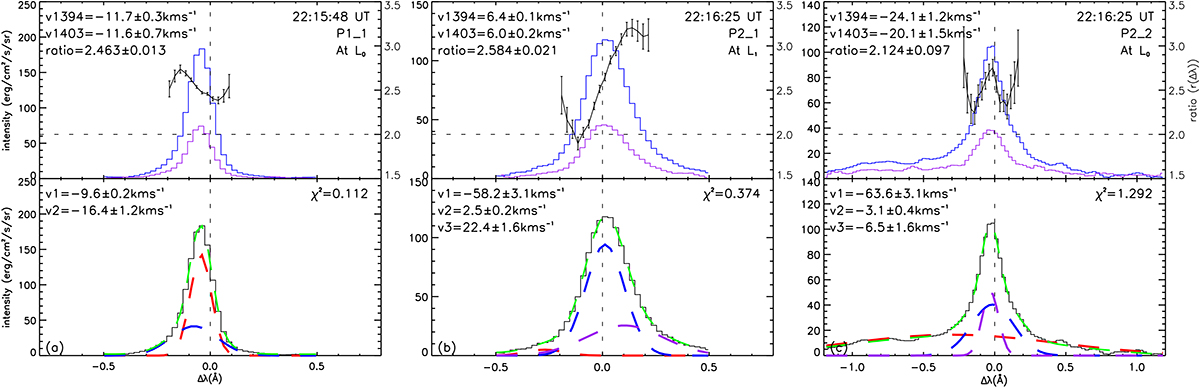
Fig. 4.
Download original image
Line profiles of Si IV 1394 Å (blue) and 1403 Å (purple) at loop positions prior to the bifurcated eruption. In the upper panels, the Doppler velocity and integrated ratio, R, were derived from moment analysis. The ratio r(Δλ) is plotted with error bars. The vertical dashed lines indicate the line center of two Si IV resonance lines, while the dashed horizontal lines are for r(Δλ) = 2. The lower panels show the observed Si IV 1394 Å line (histogram) and fit line profiles (red, blue, and purple) at each position. The velocities, v1, v2, and v3, were derived from Gaussian fitting of each component. The dashed green lines indicate the combined Gaussian fitting. The χ2 values in each panel have been divided by the number of degrees of freedom.
Current usage metrics show cumulative count of Article Views (full-text article views including HTML views, PDF and ePub downloads, according to the available data) and Abstracts Views on Vision4Press platform.
Data correspond to usage on the plateform after 2015. The current usage metrics is available 48-96 hours after online publication and is updated daily on week days.
Initial download of the metrics may take a while.