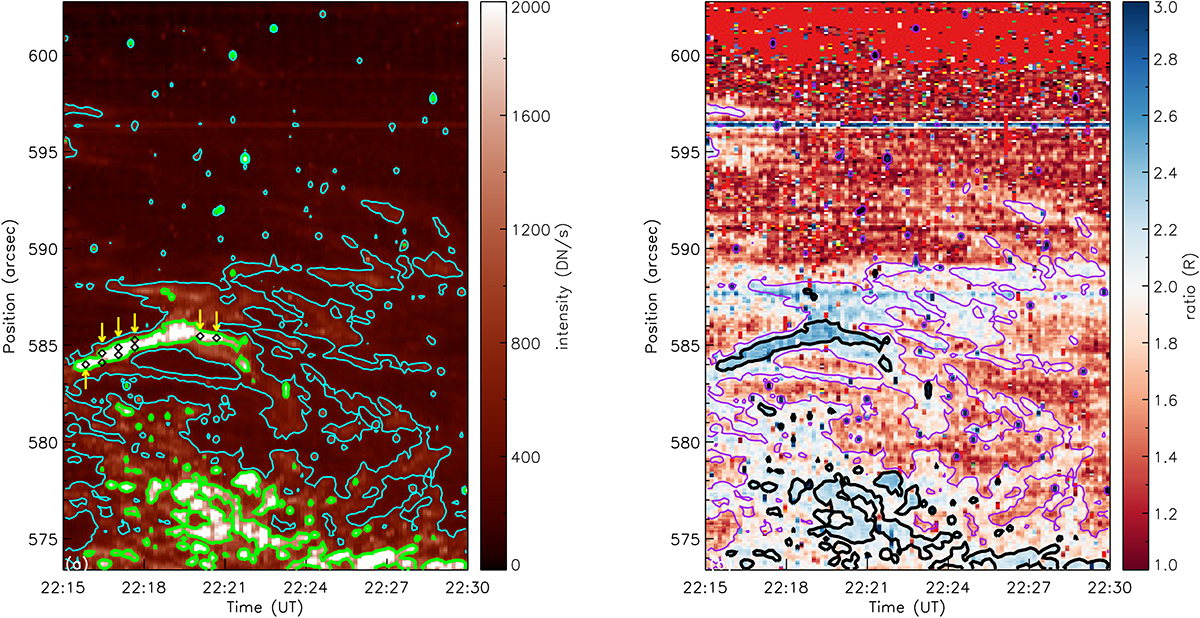
Fig. 3.
Download original image
Space-time maps of the total intensity of the Si IV 1394 Å line and the integrated ratio, R. The green-black and cyan-purple contours in each panel indicate areas with an intensity thrice the average of the quiet region and 0.05 times the maximum intensity of observed region, respectively. The positions selected for study are marked with black diamonds and yellow arrows.
Current usage metrics show cumulative count of Article Views (full-text article views including HTML views, PDF and ePub downloads, according to the available data) and Abstracts Views on Vision4Press platform.
Data correspond to usage on the plateform after 2015. The current usage metrics is available 48-96 hours after online publication and is updated daily on week days.
Initial download of the metrics may take a while.