Fig. 2.
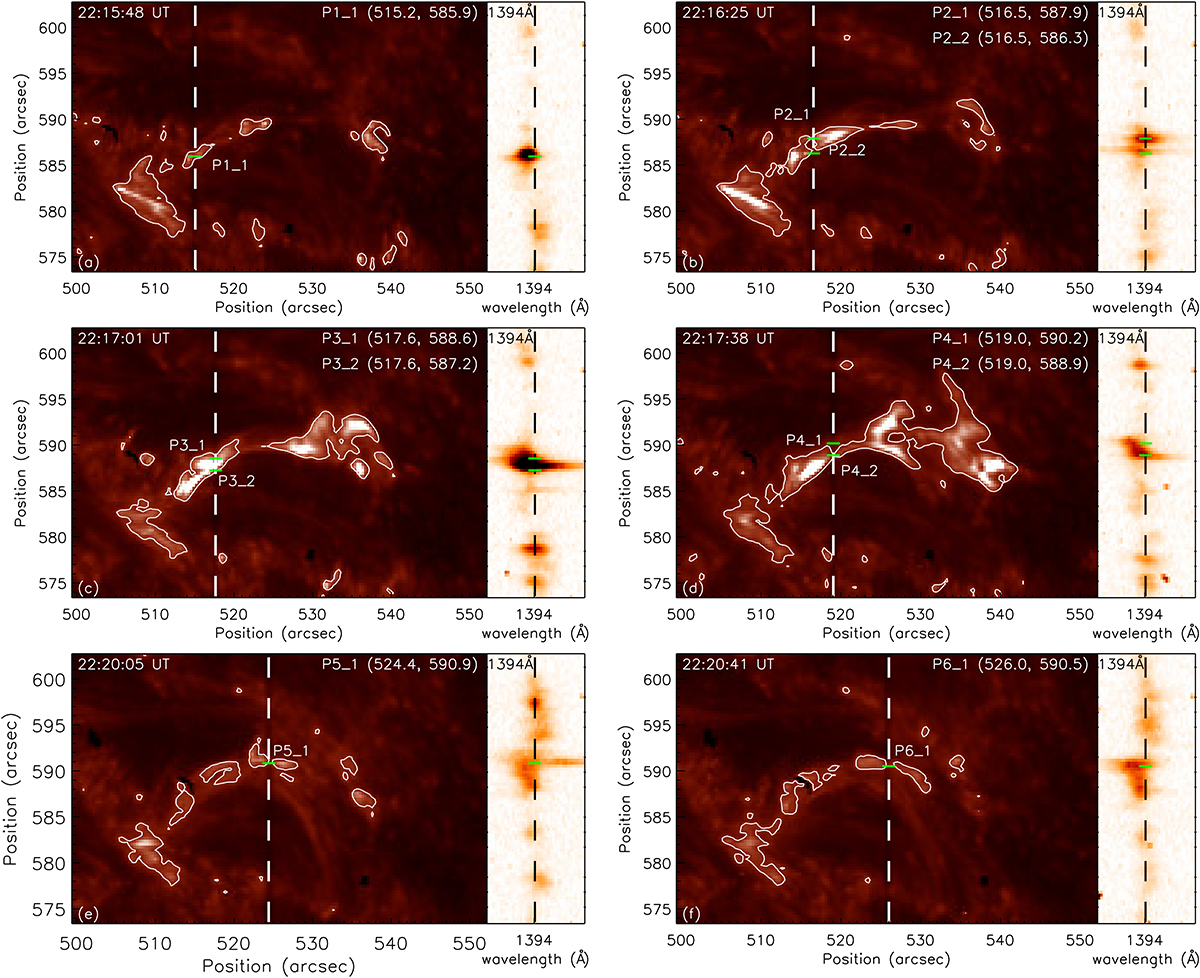
Download original image
IRIS SJI 1400 Å images and the 1394 Å spectra during the eruption. Within SJI 1400 Å, the positions denoted by Px_y and highlighted with short green lines were selected for further study. The white contours represent areas with an intensity thrice the average of the quiet region. The dashed white lines in the SJIs denote the position of the slit. Dashed black lines in the spectra indicate the line center of Si IV 1394 and 1403 Å, while the short green lines indicate the position of Px_y, respectively. The precise coordinates of each Px_y are shown in each panel.
Current usage metrics show cumulative count of Article Views (full-text article views including HTML views, PDF and ePub downloads, according to the available data) and Abstracts Views on Vision4Press platform.
Data correspond to usage on the plateform after 2015. The current usage metrics is available 48-96 hours after online publication and is updated daily on week days.
Initial download of the metrics may take a while.