Fig. 1.
Download original image
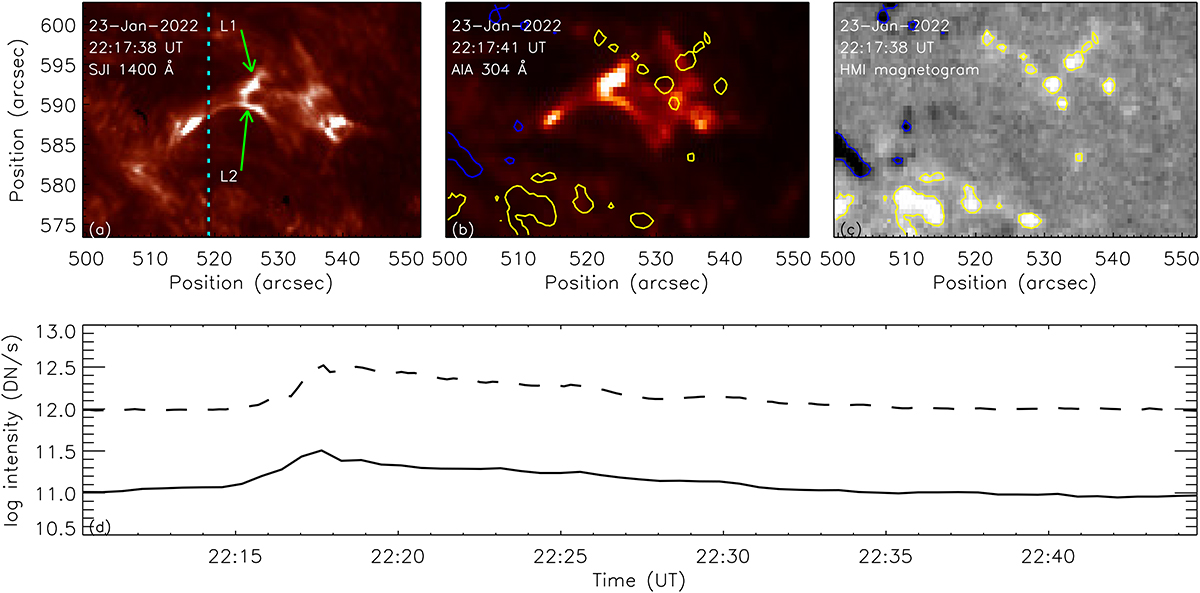
Overview of the bifurcated eruption and time profiles of the total intensity. Panels a–c: Overview of the bifurcated eruption around 22:17:40 UT in NOAA AR 12932 acquired at SJIs 1400 Å, AIA 304 Å, and the HMI magnetogram, respectively. In panel a, isolated loops are marked by L1 and L2. The dotted cyan line in SJIs indicates the slit position at 22:17:38 UT. The yellow and blue isogauss contours in panels b and c are the levels of ±50 G, respectively. Panel d: Time profiles of the total intensity of AIA 304 Å (dashed) and SJI 1400 Å (solid) during the eruption.
Current usage metrics show cumulative count of Article Views (full-text article views including HTML views, PDF and ePub downloads, according to the available data) and Abstracts Views on Vision4Press platform.
Data correspond to usage on the plateform after 2015. The current usage metrics is available 48-96 hours after online publication and is updated daily on week days.
Initial download of the metrics may take a while.