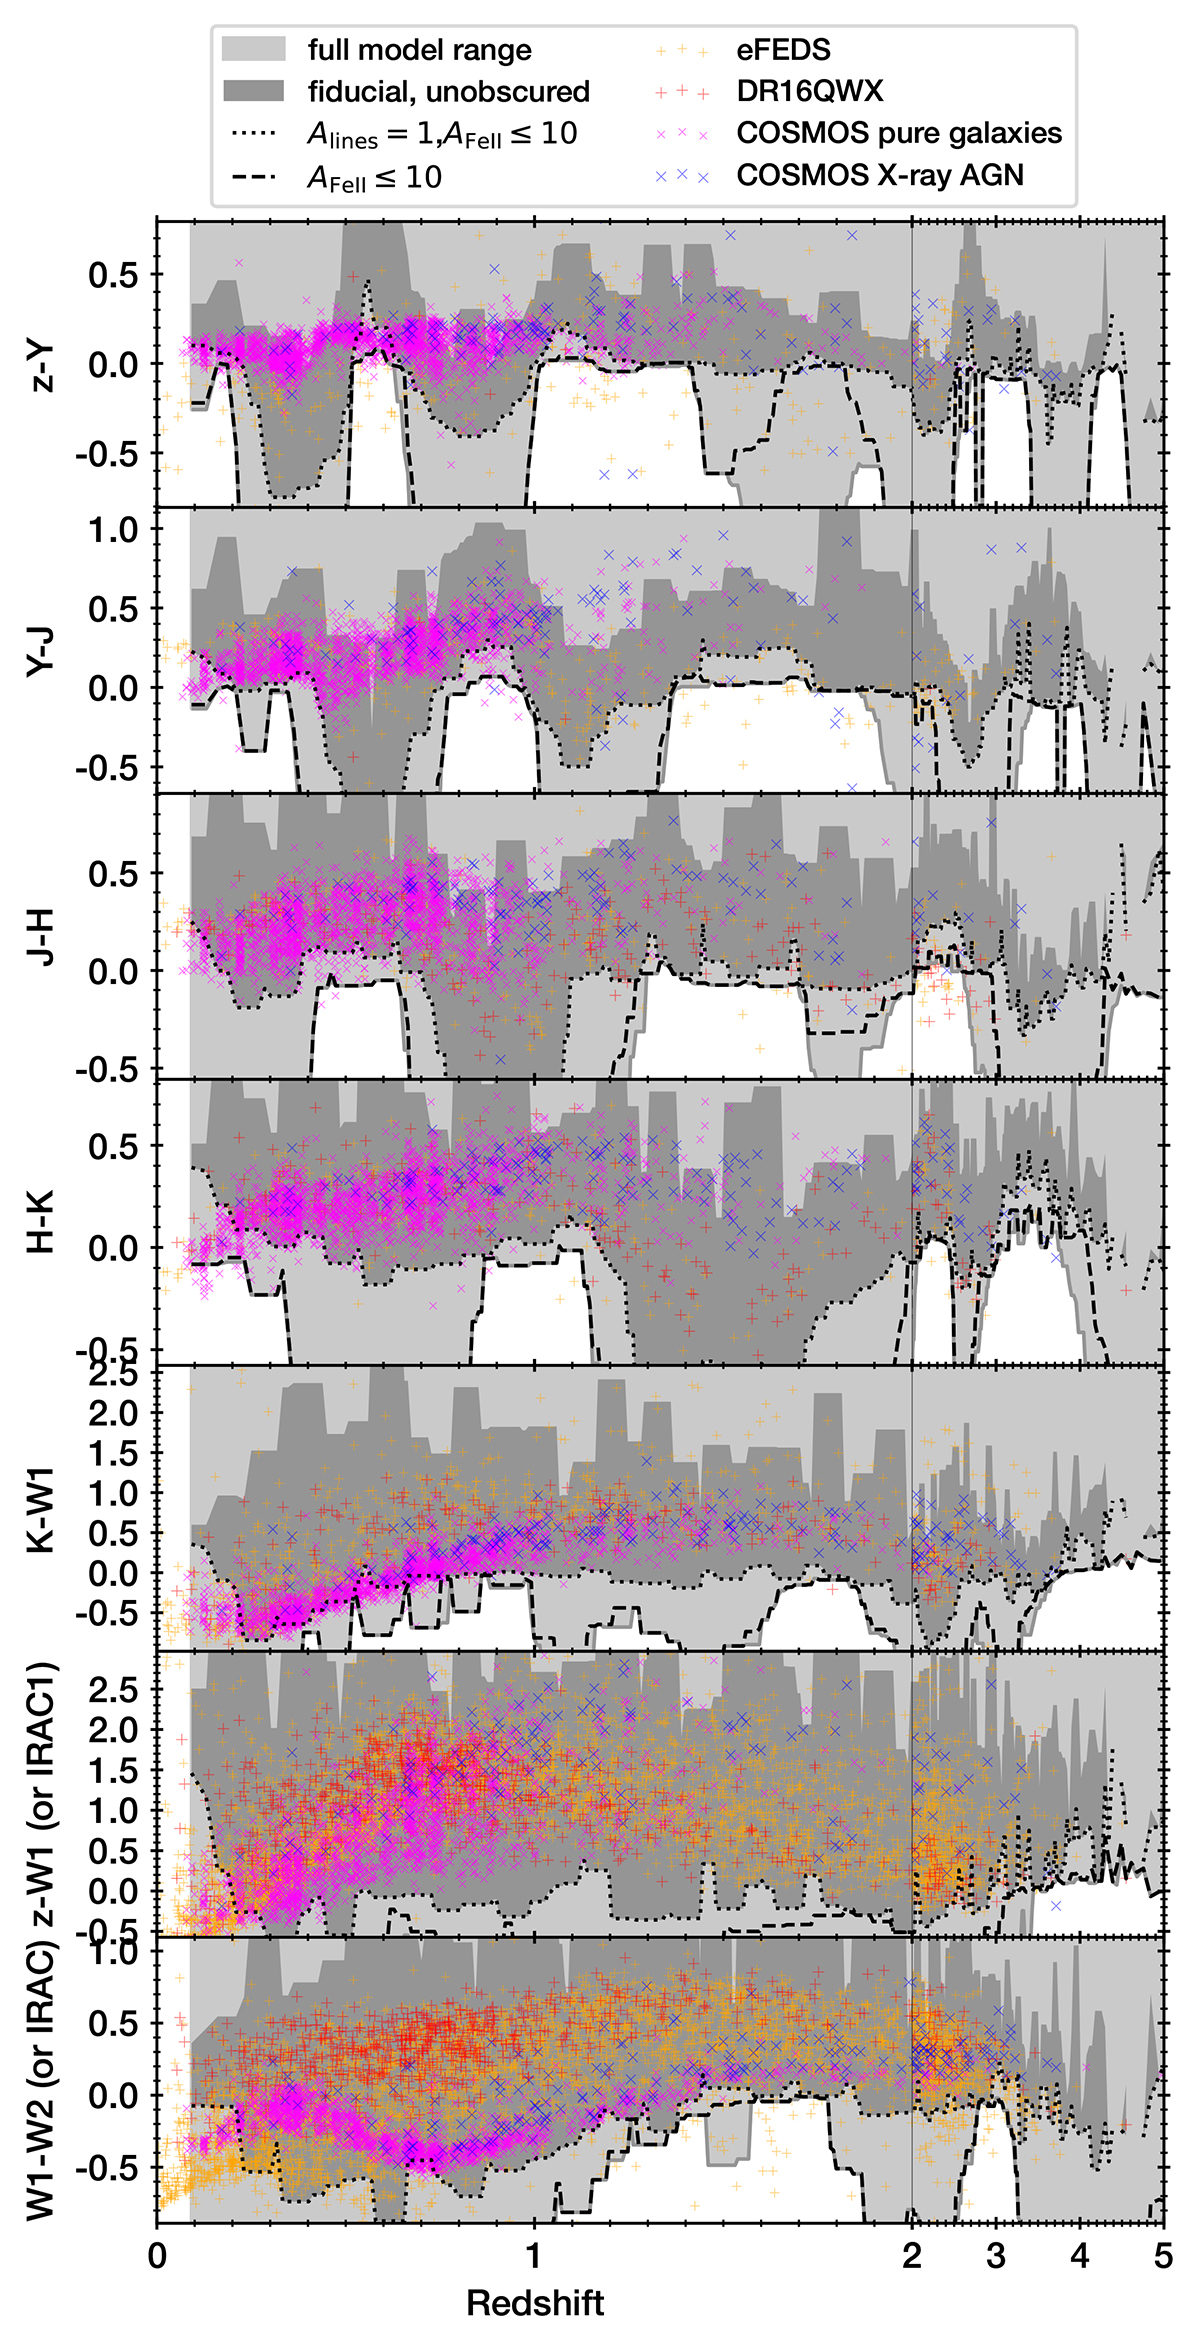
Fig. E.4.
Download original image
Colour evolution with redshift (continued from Fig. E.3). Each row shows one colour. Observations are shown in dots for different samples. At each redshift, the model templates cover the observed range, illustrated by the grey area. Filters are from DECAM/UltraVista/WISE for eFEDS, DR16QWX and the model, but from Subaru/HSC/WFCAM/CFHT/IRAC for COSMOS, making the comparison slightly inconsistent.
Current usage metrics show cumulative count of Article Views (full-text article views including HTML views, PDF and ePub downloads, according to the available data) and Abstracts Views on Vision4Press platform.
Data correspond to usage on the plateform after 2015. The current usage metrics is available 48-96 hours after online publication and is updated daily on week days.
Initial download of the metrics may take a while.