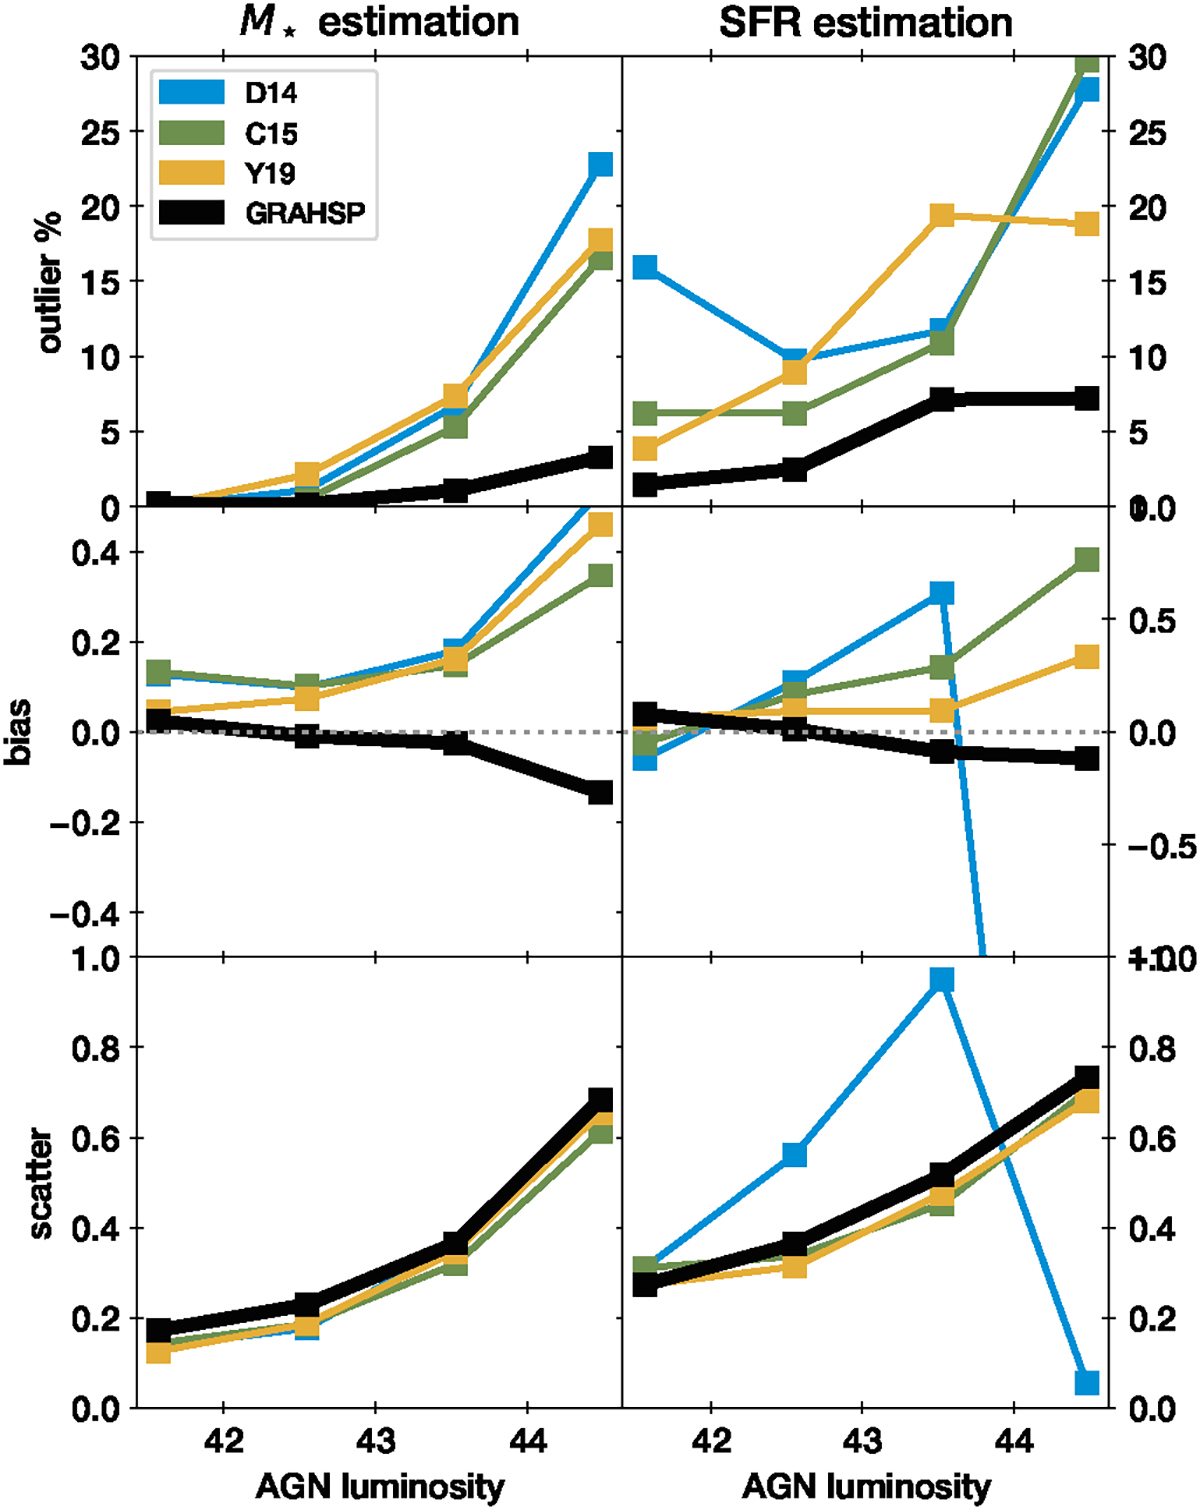
Fig. 24.
Download original image
Comparison of codes and models on the Chimera benchmark data sets. The panel rows show the outlier fraction (see Fig. 21), the bias and scatter in dex. The first column shows stellar mass estimation (from Fig. 21), the second column star-formation rate estimation (from Fig. 23). Each curve as a function of AGN bolometric luminosity (log, in erg/s) represents one method. The outlier fraction of GRAHSP is lower than those of other methods. The bias of GRAHSP is near-zero. Other methods systematically overestimate the masses in luminous AGN (middle left panel), and star-formation rates (middle right panel).
Current usage metrics show cumulative count of Article Views (full-text article views including HTML views, PDF and ePub downloads, according to the available data) and Abstracts Views on Vision4Press platform.
Data correspond to usage on the plateform after 2015. The current usage metrics is available 48-96 hours after online publication and is updated daily on week days.
Initial download of the metrics may take a while.