Fig. 23.
Download original image
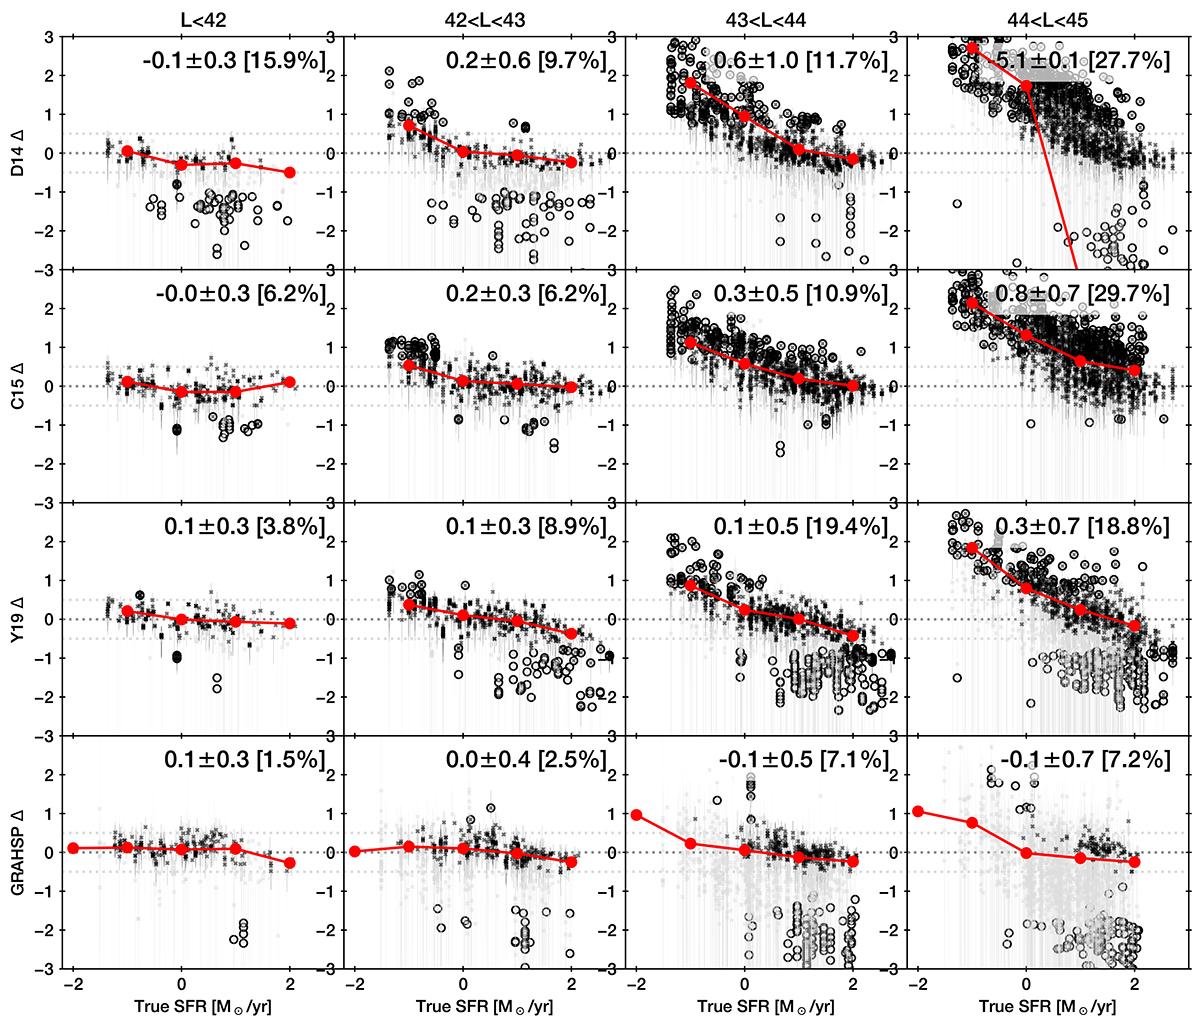
Star formation rate retrieval on the Chimera benchmark data set. As in Fig. 21. Each panel shows the deviation of the estimated SFR from the true SFR (in log units of M⊙/yr, x-axis). The first three rows’ right panels show the performance of current models at moderate AGN luminosities. Overestimates by 1–2 dex are common at low star formation rates, with outlier fractions between 10–30 per cent. The bias of GRAHSP (last row) is lower and the outlier fraction consistently below 10 per cent.
Current usage metrics show cumulative count of Article Views (full-text article views including HTML views, PDF and ePub downloads, according to the available data) and Abstracts Views on Vision4Press platform.
Data correspond to usage on the plateform after 2015. The current usage metrics is available 48-96 hours after online publication and is updated daily on week days.
Initial download of the metrics may take a while.