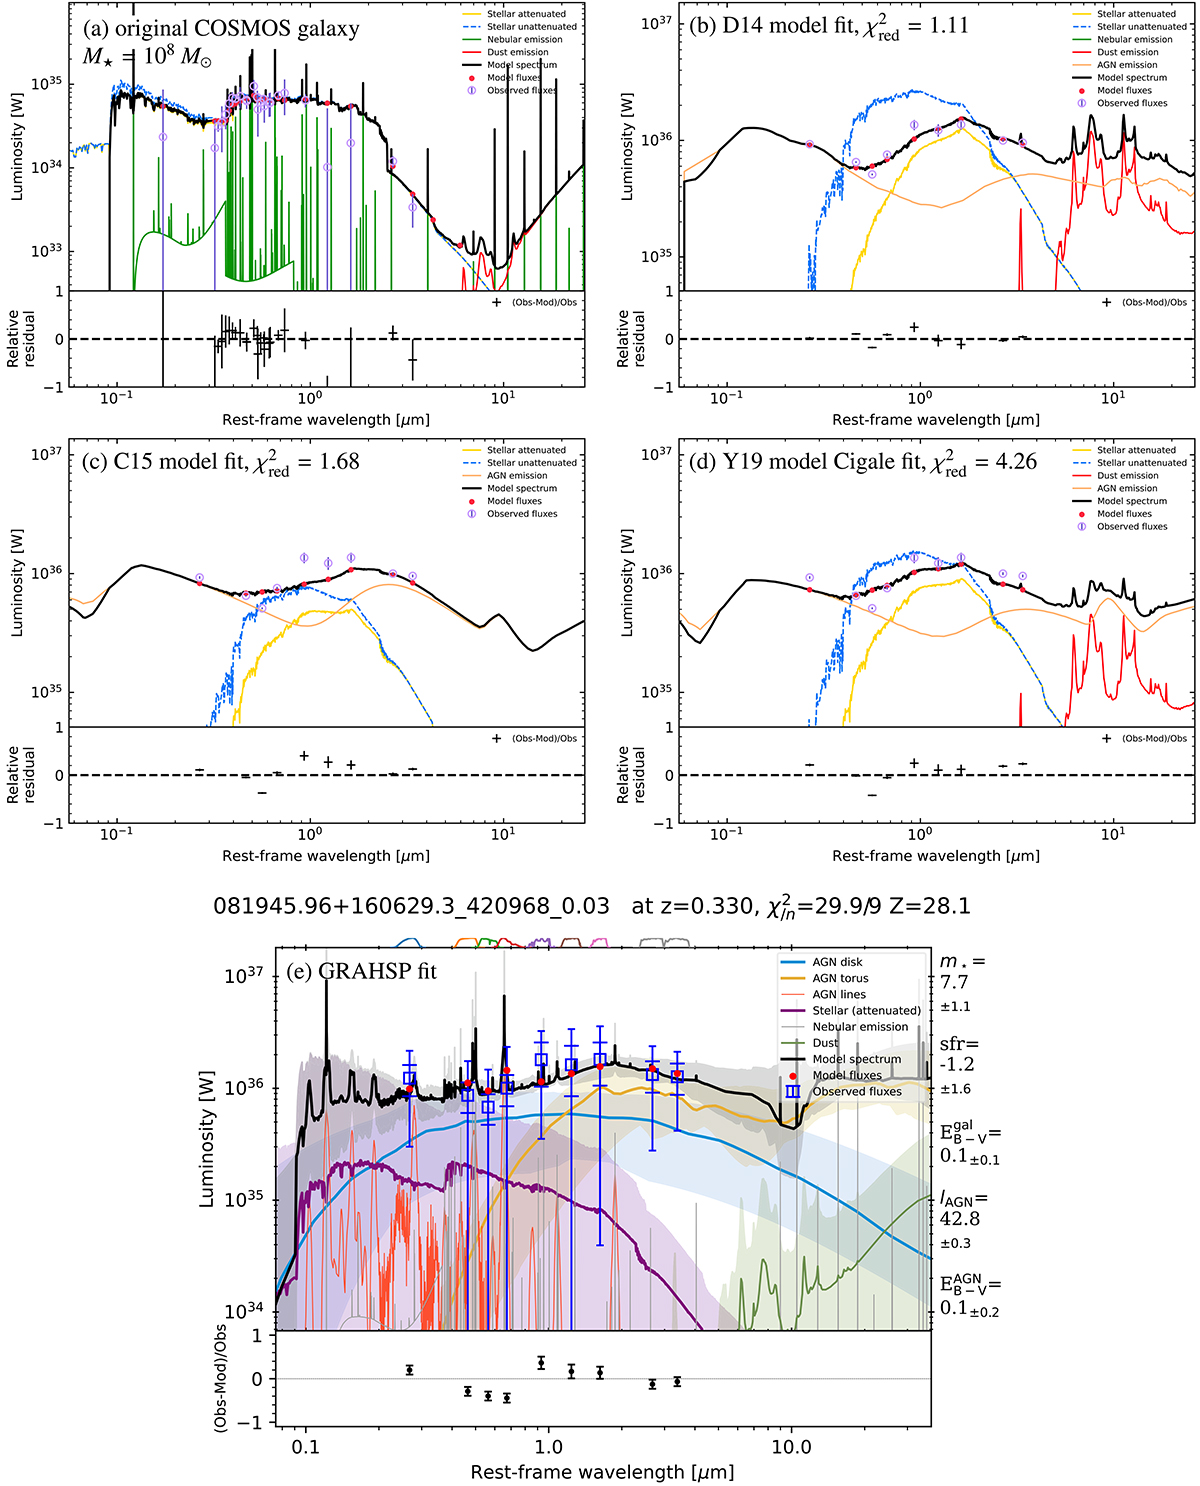
Fig. 22.
Download original image
Example of outlier in CIGALE-based analyses from the 1043 − 44 erg/s AGN luminosity bin. Panel (a) shows the original COSMOS data (CosmosId: 420968 at z = 0.33), where a M⋆ = 108 M⊙ galaxy-only model (black) reproduces the observed fluxes (purple) with small residuals (χred2 = 0.4). Panels (b), (c) and (d) present CIGALE fit to the Chimera fluxes (purple) with D14, C15 and Y19 settings. In all three models, the galaxy template is incorrectly placed at 1036 W instead of < 1035 W as in panel (a). In the C15 and Y19 models, the best-fit model is dominated by the AGN component (orange). The bottom panel (e) shows the fit by GRAHSP for the same object. The galaxy component has very large uncertainties (purple shade at the bottom), but includes the true stellar contribution (compare the purple curve here to the black curve in the top left panel). The error budget has slightly increased during the analysis from the blue error bars with wider caps to those with thin caps. The power-law AGN model (blue) dominates the fit at all wavelengths.
Current usage metrics show cumulative count of Article Views (full-text article views including HTML views, PDF and ePub downloads, according to the available data) and Abstracts Views on Vision4Press platform.
Data correspond to usage on the plateform after 2015. The current usage metrics is available 48-96 hours after online publication and is updated daily on week days.
Initial download of the metrics may take a while.