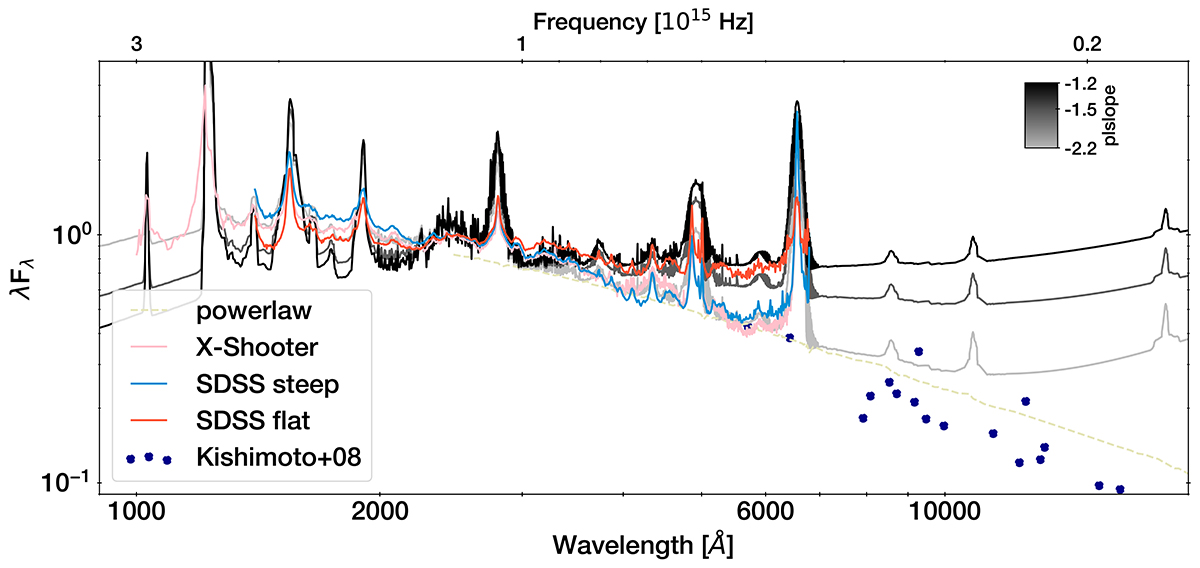
Fig. 2.
Download original image
Detailed view of the optical continuum and emission lines. The model continuum bending power-law (yellow dashed line) reproduces the polarization measurements of Kishimoto et al. (2008) (dark blue data points). The full model including a torus and emission lines is shown in solid lines. Variations of the power-law slope (light grey to black) reproduce SDSS steep and flat unabsorbed spectra from Richards et al. (2006) and Selsing et al. (2016) (red, blue and pink lines). Towards the infrared, the torus component dominates the continuum.
Current usage metrics show cumulative count of Article Views (full-text article views including HTML views, PDF and ePub downloads, according to the available data) and Abstracts Views on Vision4Press platform.
Data correspond to usage on the plateform after 2015. The current usage metrics is available 48-96 hours after online publication and is updated daily on week days.
Initial download of the metrics may take a while.