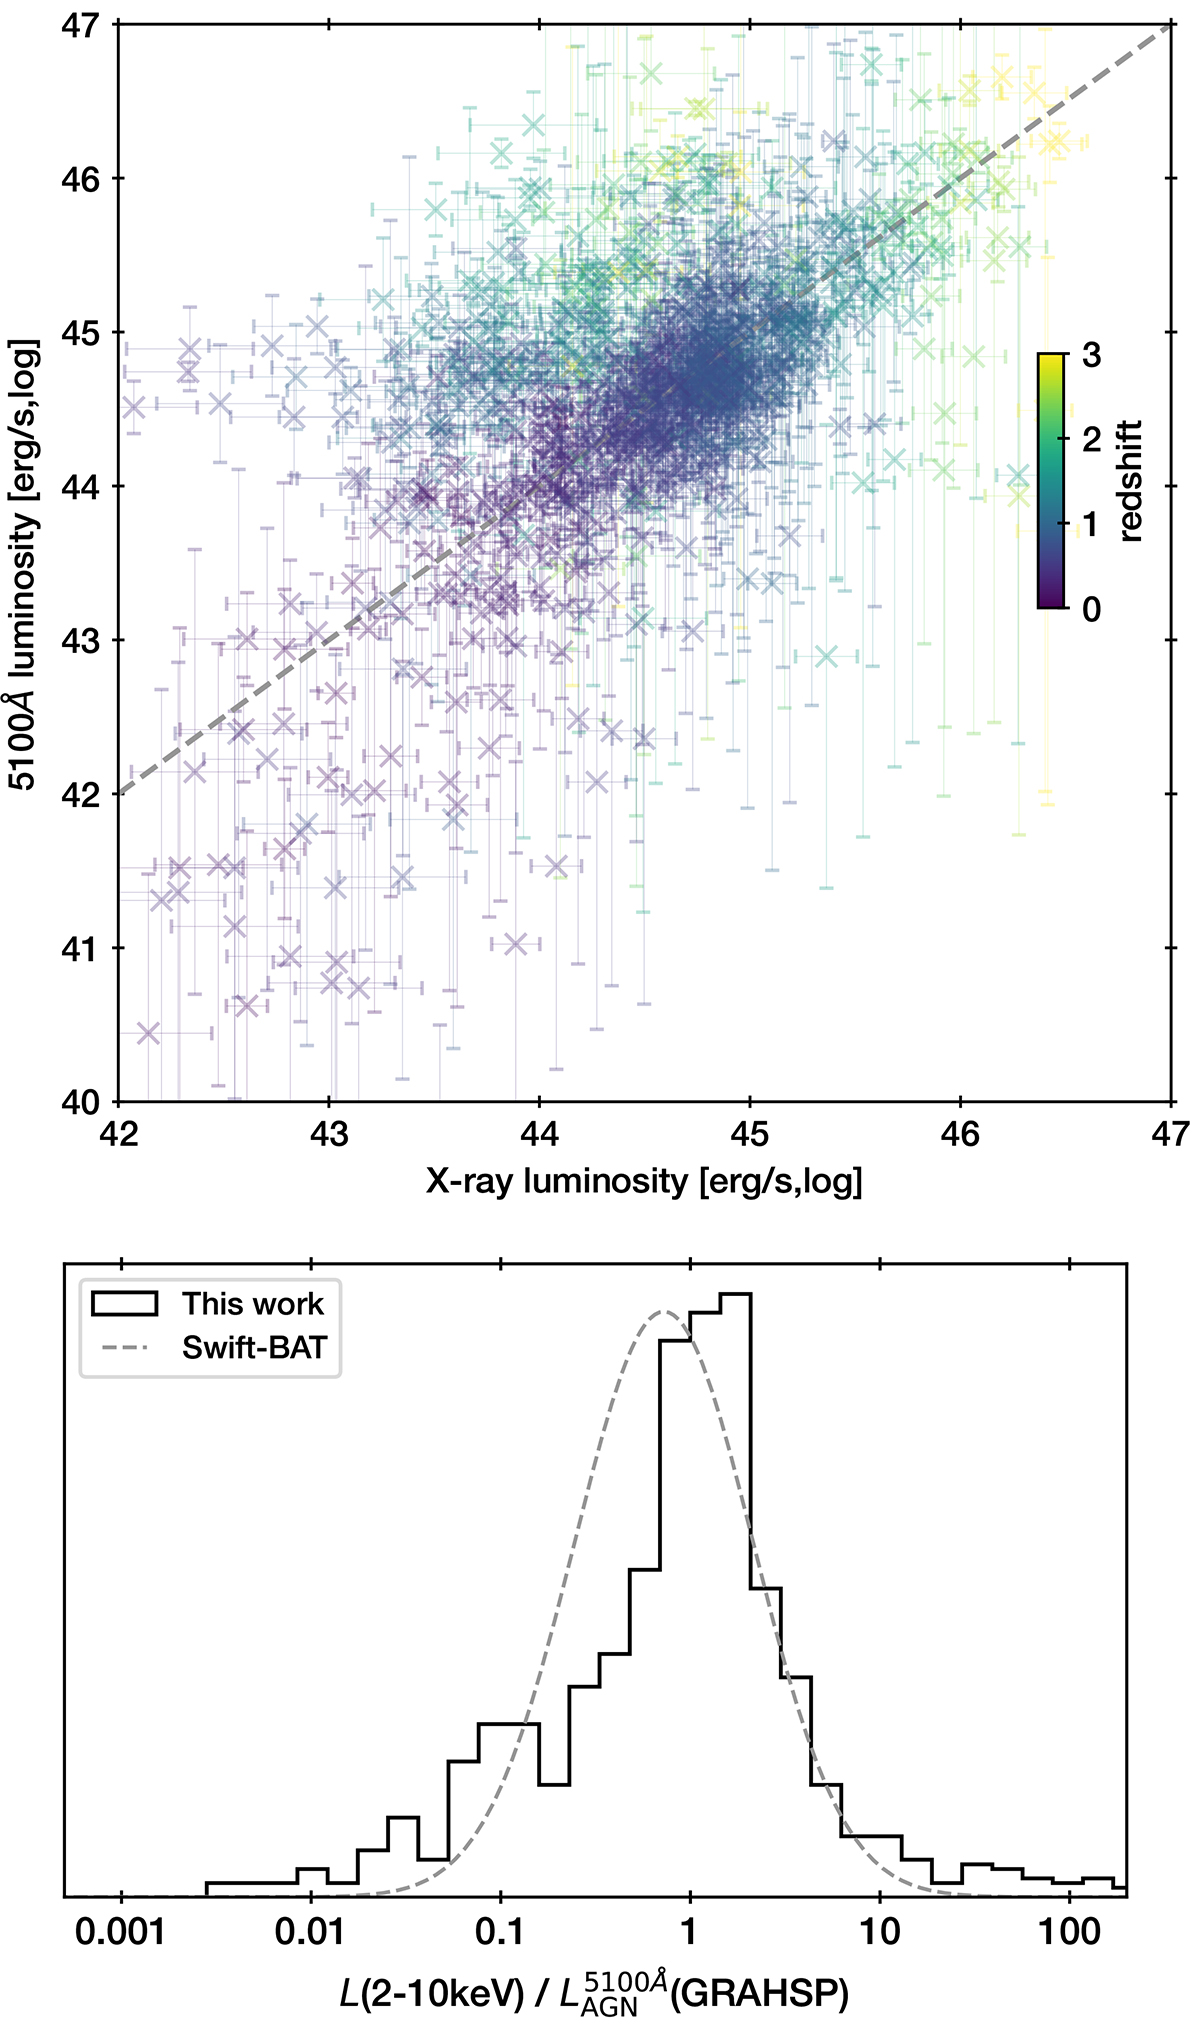
Fig. 18.
Download original image
Extension to X-rays. Top panel: The AGN luminosity at 5100 Å inferred from GRAHSP is compared to the 2 − 10 keV luminosity from X-ray observations in the DR16QWX sample. Points are colour-coded by redshift, with yellow indicating the highest redshifts. Bottom panel: The ratio is shown as a black histogram. For comparison, the grey dashed curve represents the mean ratio and scatter observed by Koss et al. (2018).
Current usage metrics show cumulative count of Article Views (full-text article views including HTML views, PDF and ePub downloads, according to the available data) and Abstracts Views on Vision4Press platform.
Data correspond to usage on the plateform after 2015. The current usage metrics is available 48-96 hours after online publication and is updated daily on week days.
Initial download of the metrics may take a while.