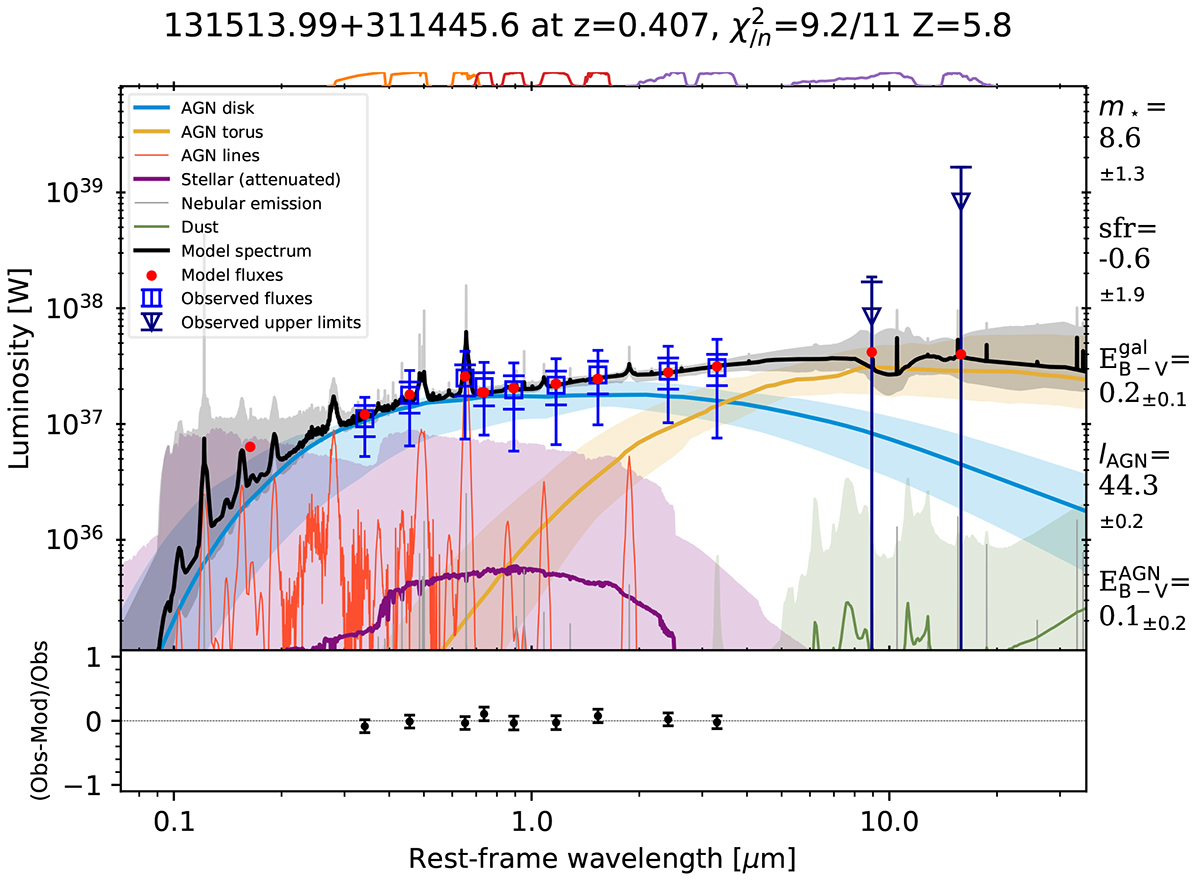
Fig. 14.
Download original image
Example of an AGN-dominated SED fit from the DR16QWX sample. The total model (black) and the individual components (colours, see legend) are presented with the posterior mean (solid line) and 2 sigma equivalent uncertainties (shaded areas). Observed fluxes are shown as blue data points with blue squares and wide blue capped 3σ error bars. The overlaid blue error bars with thin caps show the enlarged total error budget after the fit. The filter curves of observed photometric bands are shown at the top, grouped to the same colours by instrument. Predicted model fluxes are shown as red points. These can deviate from the black curve because of the averaging over the filter curve. The bottom panel presents the relative residuals of model and observations. The title lists the source ID, redshift, χ2 (Eq. (8)) per number of data points and Bayesian model evidence. On the right, key values are shown, including the stellar mass (in M⊙), star formation rate (in M⊙/yr), the galactic and AGN extinction, and the 5100 Å AGN luminosity (in erg/s). Lower case variables are logarithmic. Below 2 μm, the model is dominated by the AGN disk, and above by the torus. The third data point (z-band) is raised compared to the neighboring data points, which can be understood by the Hα emission line at that redshift. The galaxy component has an extremely wide luminosity range (purple), that is, the stellar mass is unconstrained (see the first number on the right) in this luminous AGN (see the fourth number on the right).
Current usage metrics show cumulative count of Article Views (full-text article views including HTML views, PDF and ePub downloads, according to the available data) and Abstracts Views on Vision4Press platform.
Data correspond to usage on the plateform after 2015. The current usage metrics is available 48-96 hours after online publication and is updated daily on week days.
Initial download of the metrics may take a while.