Fig. 12.
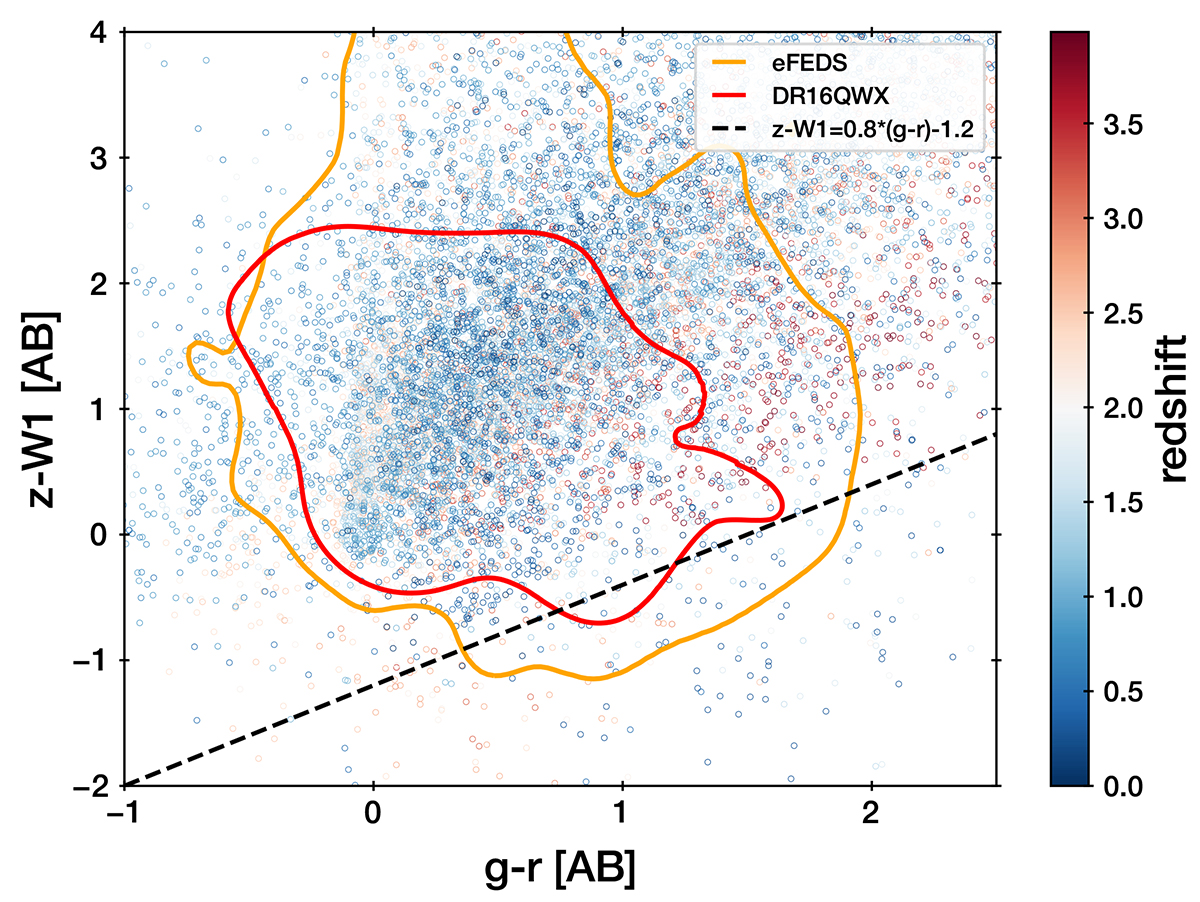
Download original image
Colour diagnostic plot. The GRAHSP templates (coloured dots as a function of redshift) cover the entire plane. The observations are illustrated by coloured contours containing 99% of each sample. At the centre-left, quasars dominate (red outline, DR16QWX), while the eFEDS sample includes a wider distribution. The dashed diagonal line demarks the separation of Salvato et al. (2022) between galaxies (above) and stars (below the line).
Current usage metrics show cumulative count of Article Views (full-text article views including HTML views, PDF and ePub downloads, according to the available data) and Abstracts Views on Vision4Press platform.
Data correspond to usage on the plateform after 2015. The current usage metrics is available 48-96 hours after online publication and is updated daily on week days.
Initial download of the metrics may take a while.