Fig. 7

Download original image
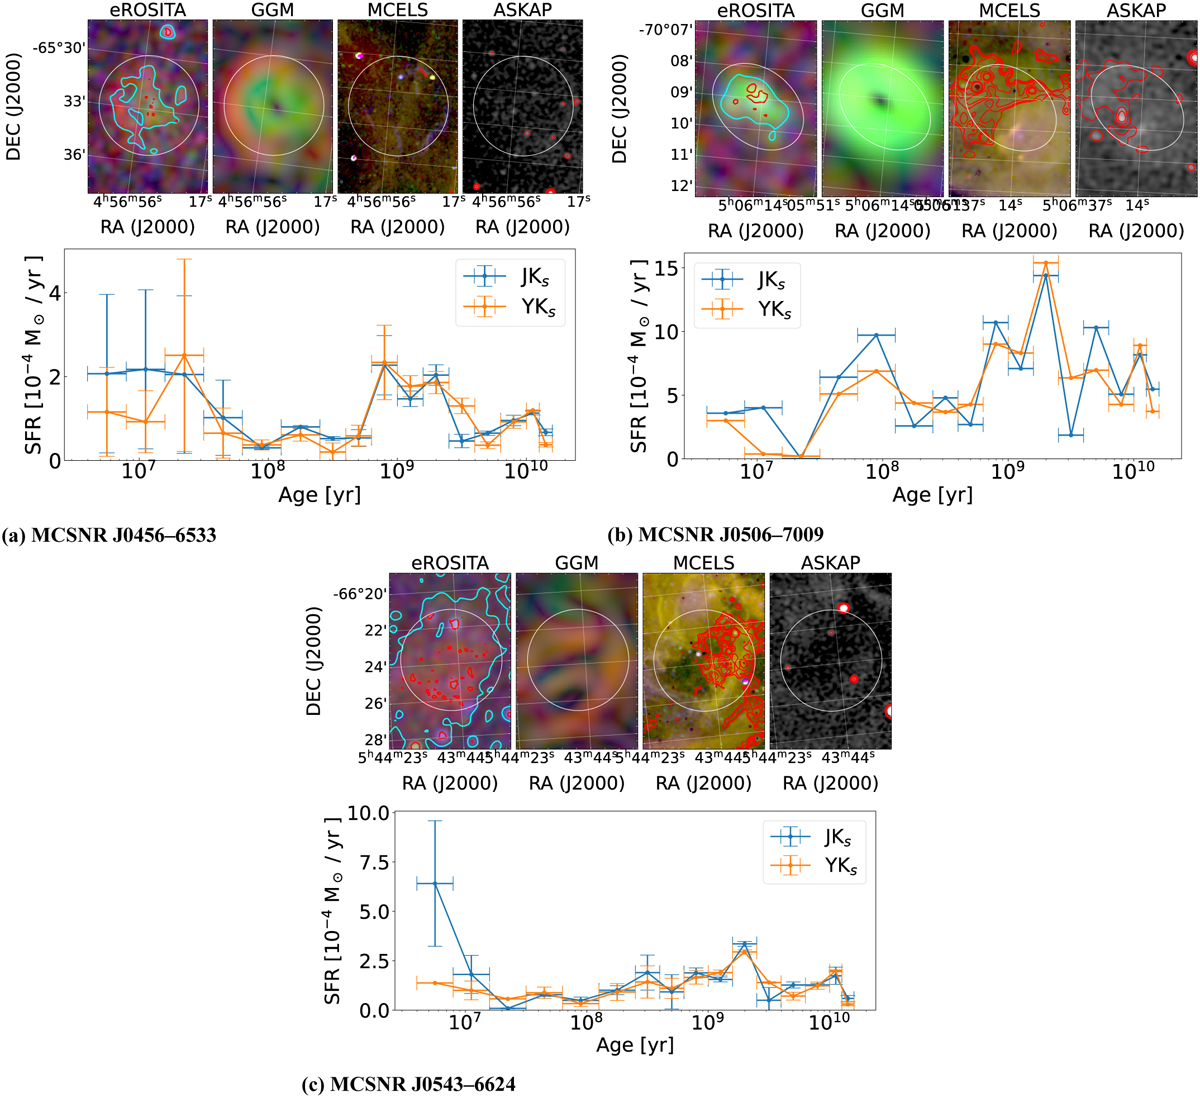
For each source, the eROSITA count rate three-colour image (left) with red: 0.2–0.7keV, green: 0.7–1.1 keV, and blue: 1.1–5.0keV; the GGM filter image (see Sect. 3.5) applied to the eROSITA count rate (middle left); the MCELS survey three-colour image (middle right) with red: Hα, green: [S II], and blue: [O III]; and the ASKAP radio continuum image (right) in the upper panel. The white circles (ellipses) show the extraction region for determining the count rates (see Sect. 3.3). The cyan (red) contours in the eROSITA three-colour image show the detection at 1σ (3σ) over the background in the energy band 0.2–1.1 keV. The contours in the optical image represent [S II]/Hα > 0.67. The contours in the radio image show the non-thermal emission calculated as described in Sect. 4.2. In the lower panel we show the SFH as calculated in Mazzi et al. (2021) using J – Ks and Y – Ks (see Sect. 5).
Current usage metrics show cumulative count of Article Views (full-text article views including HTML views, PDF and ePub downloads, according to the available data) and Abstracts Views on Vision4Press platform.
Data correspond to usage on the plateform after 2015. The current usage metrics is available 48-96 hours after online publication and is updated daily on week days.
Initial download of the metrics may take a while.


