Fig. 5
Download original image
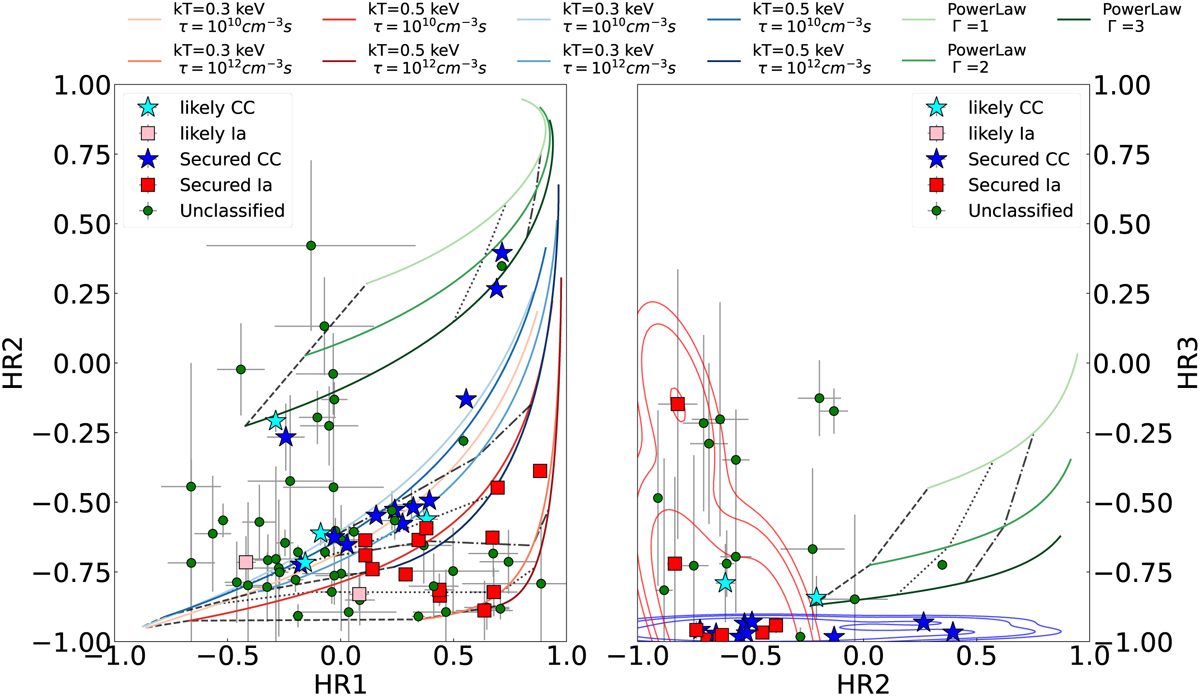
Hardness ratios of candidates and confirmed SNRs in our sample. The energy bands used to calculate the hardness ratios are for HR1 : soft (= 0.3–0.7keV) and medium (0.7–1.1 keV), for HR2: medium (0.7–1.1 keV) and hard (1.1–2.3 keV), and for HR3: hard (1.1–2.3keV) and harder (2.3–4.0 keV). The sources are separated according to the explosion type as reported in Maggi et al. (2016). The SNRs tend to be separated according to the progenitor type of the remnant. The lines describe the expected HR values assuming different models. In particular we considered Fe-rich thermal plasma emission (VNEI with Fe = 2Z⊙) plotted with red lines and O-rich thermal plasma emission (VNEI with O = 2Z⊙) plotted with blue lines with different ionisation timescales τ (τ = 1010 s cm−3 and τ = 1012 s cm−3) and different temperatures (kT = 0.3 keV and kT = 0.5 keV). In addition, we also plotted power law models in green with different photon indices T (r = 1,2,3). The dashed and dotted black lines indicate different column densities NH = 0.0,0.5 and 1.0 cm−2. The contours in HR2-HR3 represent the Gaussian kernel-density estimation for core-collapse (CC) and type Ia SNRs. The contours indicate 68, 90, and 95% probability.
Current usage metrics show cumulative count of Article Views (full-text article views including HTML views, PDF and ePub downloads, according to the available data) and Abstracts Views on Vision4Press platform.
Data correspond to usage on the plateform after 2015. The current usage metrics is available 48-96 hours after online publication and is updated daily on week days.
Initial download of the metrics may take a while.