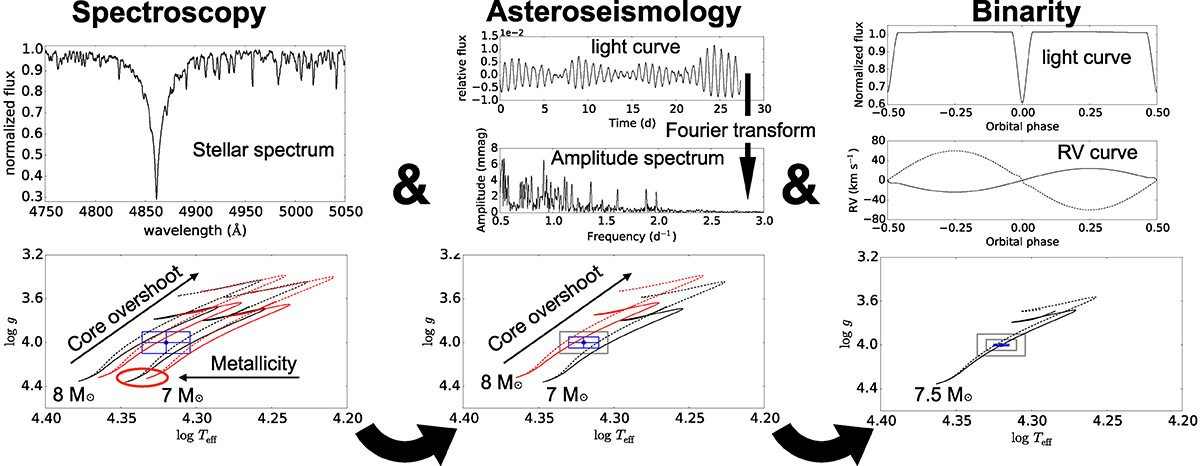
Fig. 8.
Download original image
Schematic representation of the complementarity among atmospheric, binary, and asteroseismic analyses. The top row shows observables for each method, while the bottom row highlights the gain in precision and accuracy as the probing power of the different methods is combined. The red curves in the lower left panel represent models for two masses with Z = 0.014, while the black curves have Z = 0.006. The solid lines have no core boundary mixing, while the dotted lines do, increasing the mass of the convective core along the evolutionary path. In the middle lower panel, spectroscopy has allowed us to fix the metallicity, and the red and black curves now differ only in mass, representing evolutionary paths with (dotted lines) or without (solid lines) core boundary mixing. The lower right panel illustrates that asteroseismology further allows us to pinpoint the mass and limit the amount of core boundary mixing.
Current usage metrics show cumulative count of Article Views (full-text article views including HTML views, PDF and ePub downloads, according to the available data) and Abstracts Views on Vision4Press platform.
Data correspond to usage on the plateform after 2015. The current usage metrics is available 48-96 hours after online publication and is updated daily on week days.
Initial download of the metrics may take a while.