Fig. 7.
Download original image
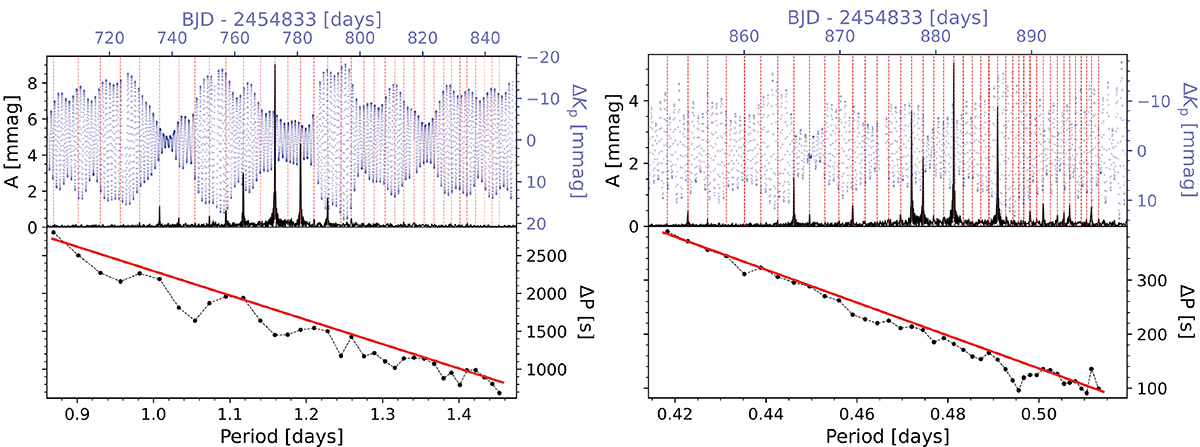
Illustration of the method used to deduce the near-core rotation frequency of a gravito-inertial mode pulsator. The upper panels show a section of the Kepler light curve of the γ Dor star KIC 8375138 (left) and the SPB star KIC 7760680 (right) as derived respectively by Pápics et al. (2015) and Van Reeth et al. (2015b) (blue dots). The amplitude spectra of the 4 yr light curve of these pulsators is overplotted (in black) and reveals a regular pattern of high-order dipole g modes of consecutive radial order (red dashed vertical lines). The lower panels show the measured period spacings of these modes as a function of the mode period (black dots connected by dashed black lines to guide the eye). The red solid line is a linear fit avoiding the trapped modes causing dips in the pattern. The slope of the linear fit is dictated by the internal rotation frequency, Ωrot, in the transition zone between the convective core and the radiative envelope, as deduced by Van Reeth et al. (2015a). The figure was reproduced from Chapter 1 in Van Beeck (2023) by Jordan Van Beeck.
Current usage metrics show cumulative count of Article Views (full-text article views including HTML views, PDF and ePub downloads, according to the available data) and Abstracts Views on Vision4Press platform.
Data correspond to usage on the plateform after 2015. The current usage metrics is available 48-96 hours after online publication and is updated daily on week days.
Initial download of the metrics may take a while.