Fig. 6.
Download original image
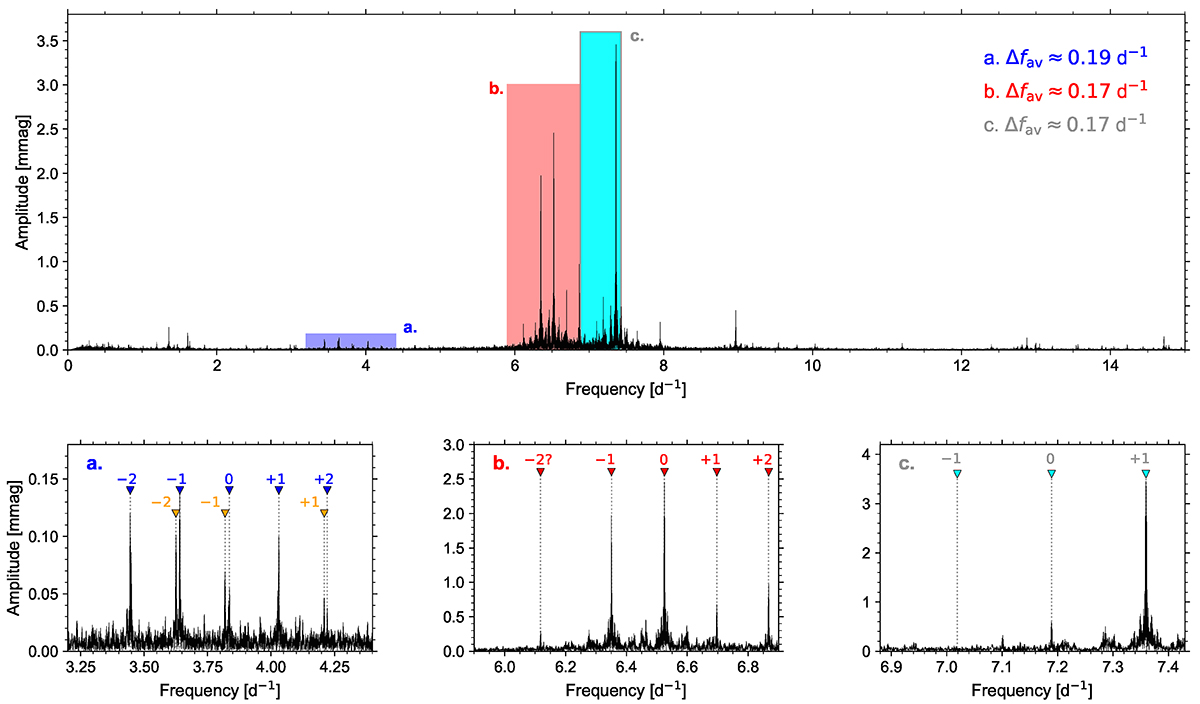
The Fourier transform of the TESS merged Cycle 2 and 4 light curve of the β Cep star HD 192575 (top). The three lower panels are zoomed-in versions of the coloured and labelled frequency ranges, whose averaged splittings are indicated in the upper panel. They consist of a merged quintuplet and quadruplet undergoing an avoided crossing (left), an isolated (possibly incomplete) quintuplet (middle), and a triplet whose prograde mode has the highest amplitude in the entire oscillation spectrum (right). The identifications for the azimuthal order m of these multiplet components are indicated above each peak. The figure was made by Siemen Burssens.
Current usage metrics show cumulative count of Article Views (full-text article views including HTML views, PDF and ePub downloads, according to the available data) and Abstracts Views on Vision4Press platform.
Data correspond to usage on the plateform after 2015. The current usage metrics is available 48-96 hours after online publication and is updated daily on week days.
Initial download of the metrics may take a while.