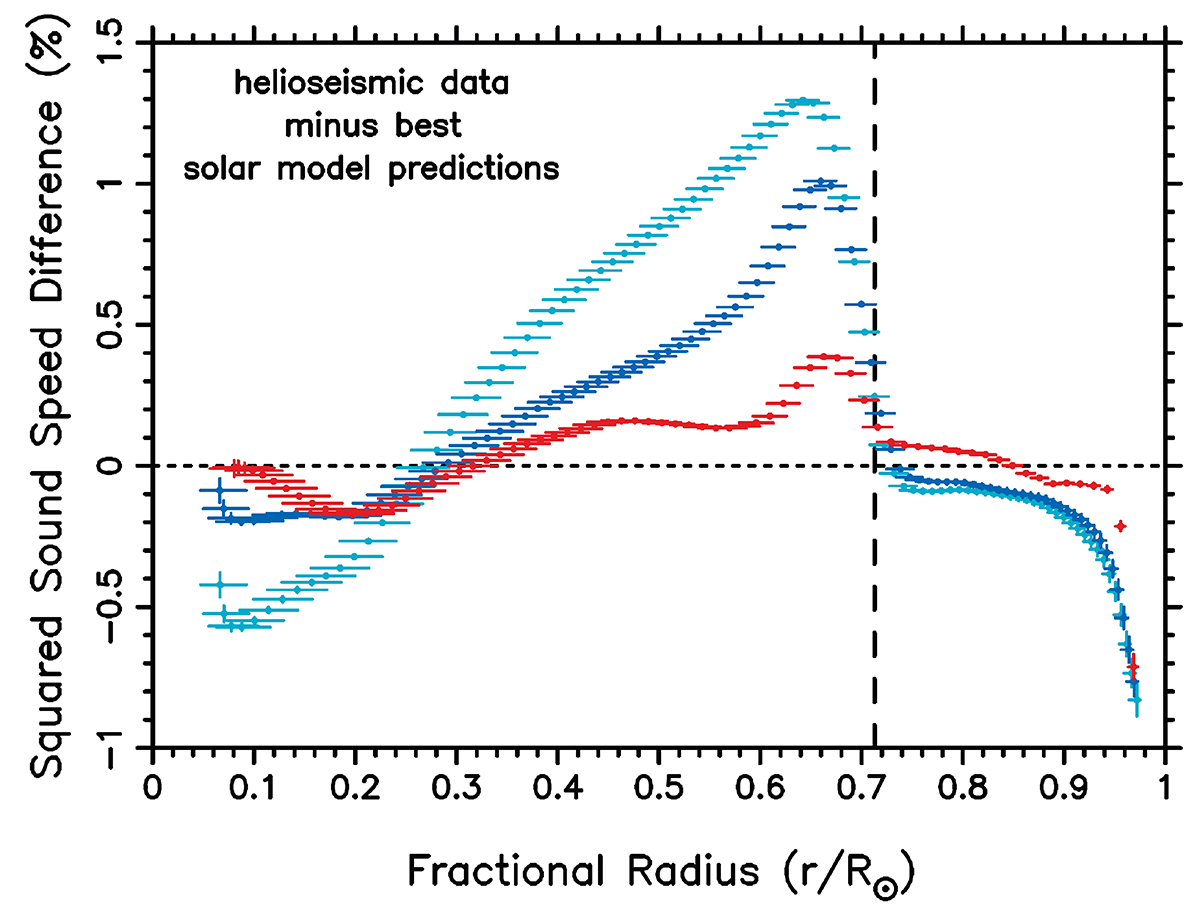
Fig. 5.
Download original image
Squared sound speed differences between helioseismic observations and predictions based on three models of the Sun from oscillation mode structure inversions. The errors along the y-axis are often smaller than the symbol size. The numerous small regions indicated by the horizontal bars along the x-axis represent the intervals in fractional radius over which the localised mode kernel averaging was done for the inversions. Models delivering perfect agreement with the solar oscillations would coincide with the dotted horizontal line. The vertical dashed line indicates the helioseismic derivation of the base of the solar convection zone. The agreement between the observations and the best model predictions has degraded since the era of Model S (Christensen-Dalsgaard et al. 1996), despite immense improvements in the description of the physics in terms of the equation of state, opacities, and transport of chemical elements in the solar interior, as explained in Christensen-Dalsgaard (2021). This downgrade is due to the adopted solar surface abundances measured by Asplund et al. (2021), who relied on 3D non-local thermodynamic equilibrium (NLTE) atmosphere models and their line predictions leading to a ratio of metals to hydrogen of Z/X = 0.0187 based on the solar calibration carried out in Buldgen et al. (2024), while LTE abundances from 1D atmosphere models from Grevesse & Noels (1993) were used for the older red curve from Model S. The blue curve results from averaged 3D NLTE-based abundances by Magg et al. (2022) leading to Z/X = 0.0225, and was computed by Dr. Gaël Buldgen relying on the physical descriptions adopted in Buldgen et al. (2023) and Buldgen et al. (2024). The figure was produced from data kindly made available by J. Christensen-Dalsgaard (red curve) and G. Buldgen (cyan and blue curves).
Current usage metrics show cumulative count of Article Views (full-text article views including HTML views, PDF and ePub downloads, according to the available data) and Abstracts Views on Vision4Press platform.
Data correspond to usage on the plateform after 2015. The current usage metrics is available 48-96 hours after online publication and is updated daily on week days.
Initial download of the metrics may take a while.