Fig. 11.
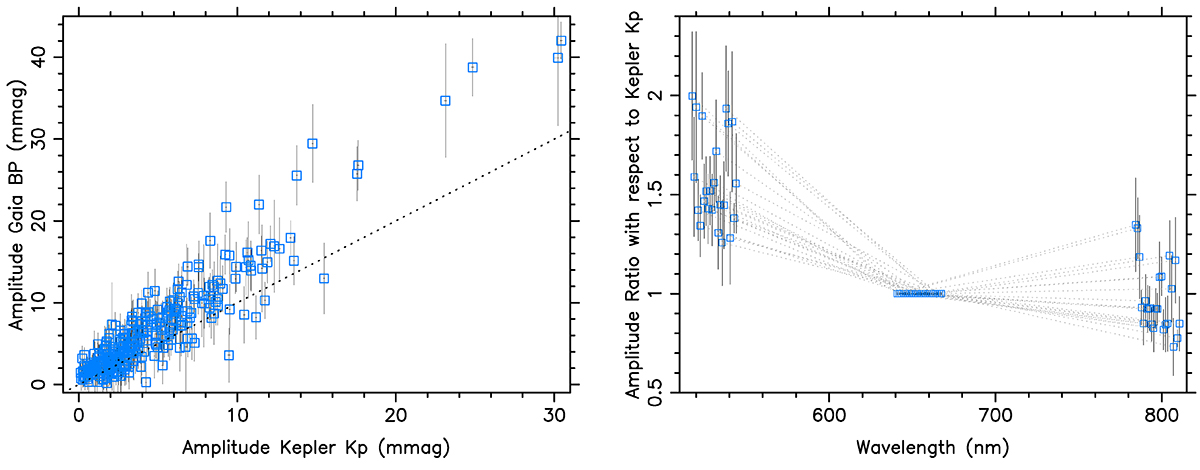
Download original image
Comparison between the amplitudes of the dominant g-mode frequency in the Gaia BP and KeplerKp bands, whose maxima in the response functions occur at 517 nm and 640 nm, respectively. The left panel shows the results for the 309 γ Dor stars from Li et al. (2020b) with time series photometry available in the public domain of both surveys. The frequency deduced from the Kepler data was imposed on the Gaia DR3 data to produce this plot. The right panel shows the Gaia BP and RP (response curve peaking at 783 nm) amplitude ratios with respect to the one in Kp, plotted as a function of wavelength for the 23 γ Dor stars in the sample with an identified dominant prograde dipole mode explaining more than 50% of the total variance in the Gaia BP and RP light curves. The three values for each star are connected by a dotted line to guide the eye. The results for each star have been shifted slightly in wavelength for visibility reasons. The errors for Kp are smaller than the symbol size.
Current usage metrics show cumulative count of Article Views (full-text article views including HTML views, PDF and ePub downloads, according to the available data) and Abstracts Views on Vision4Press platform.
Data correspond to usage on the plateform after 2015. The current usage metrics is available 48-96 hours after online publication and is updated daily on week days.
Initial download of the metrics may take a while.