Fig. 10.
Download original image
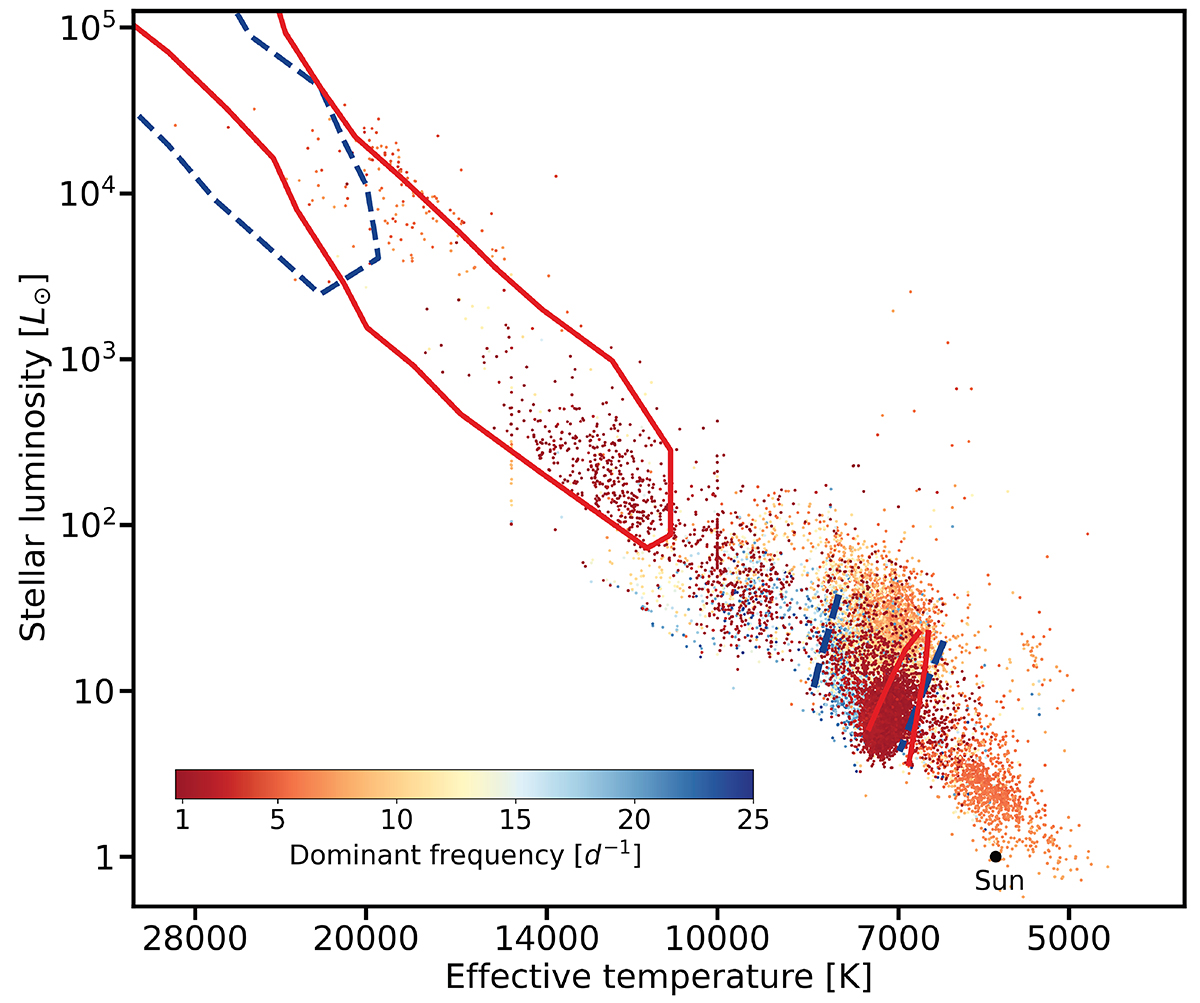
HRD showing the position of more than 100 000 candidate (non-)radial oscillators discovered from the Gaia DR3 G-band light curves, colour-coded according to their dominant frequency. The thick lines indicate the borders of four instability strips for solar metallicity computed by Burssens et al. (2020) and Dupret et al. (2005a), enclosing areas where theoretically predicted g modes (solid red lines) and p modes (dashed blue lines) are expected for the chosen input physics of the models. The figure was produced by Dr. Joris De Ridder from data in Gaia Collaboration (2023b).
Current usage metrics show cumulative count of Article Views (full-text article views including HTML views, PDF and ePub downloads, according to the available data) and Abstracts Views on Vision4Press platform.
Data correspond to usage on the plateform after 2015. The current usage metrics is available 48-96 hours after online publication and is updated daily on week days.
Initial download of the metrics may take a while.