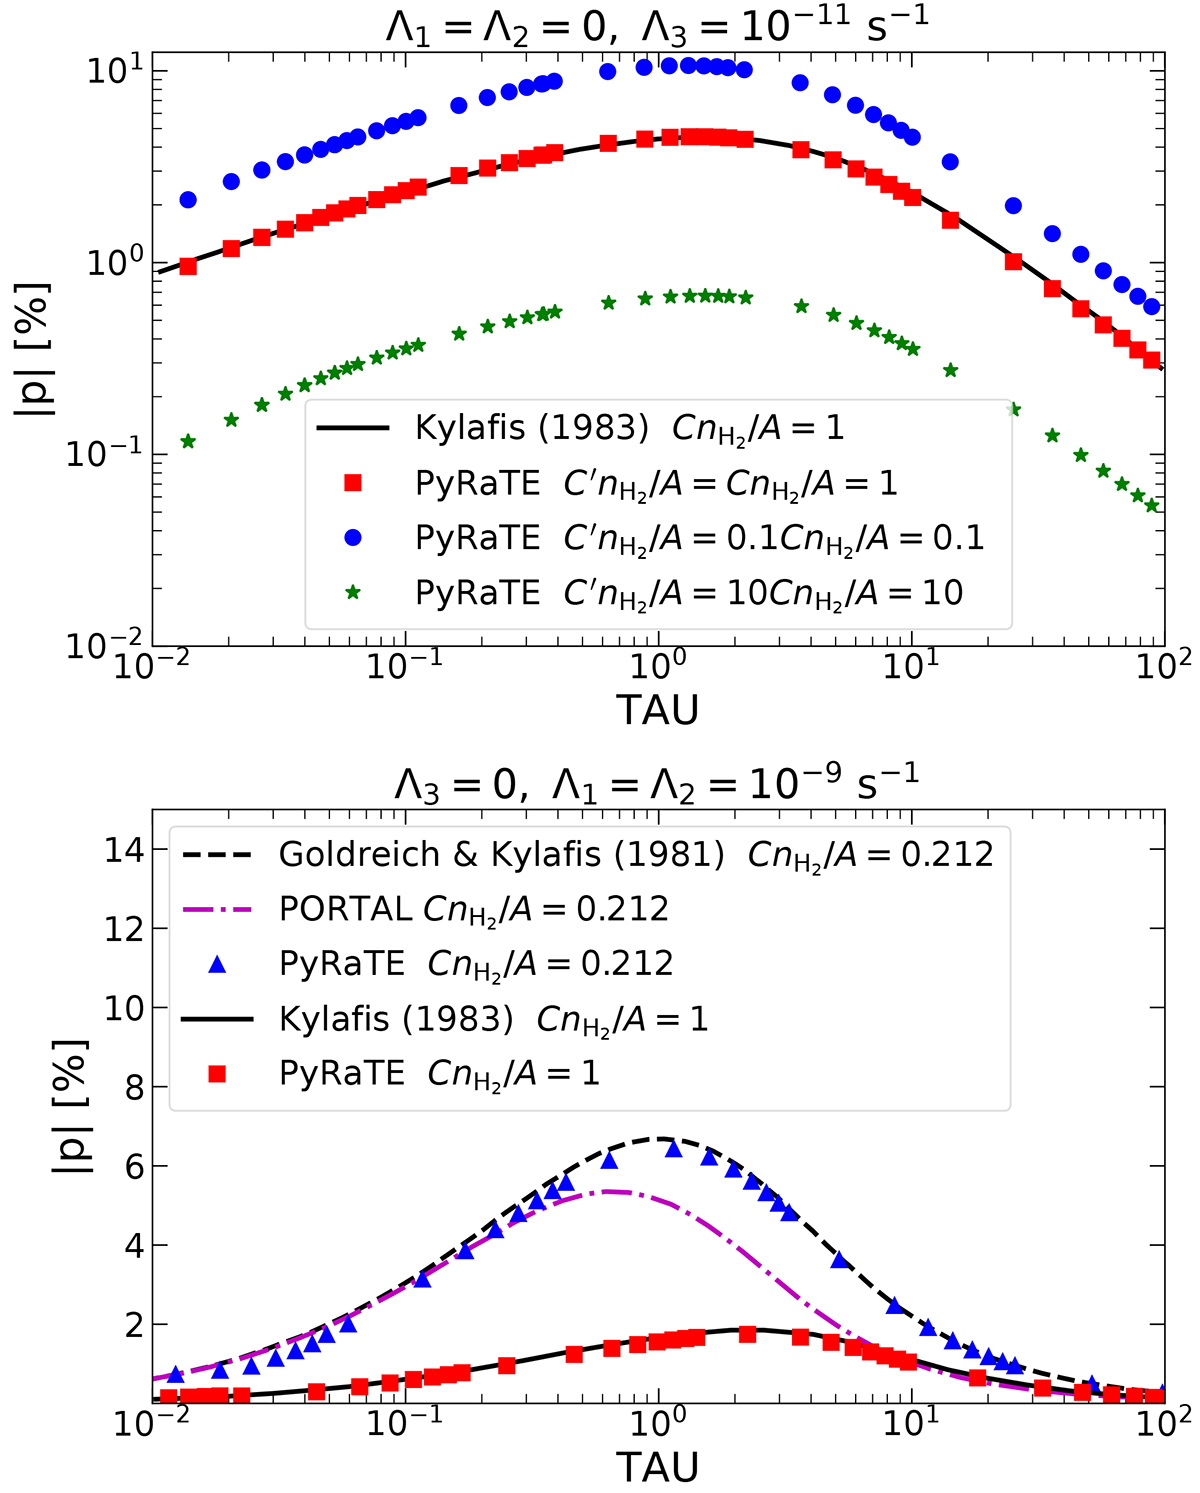
Fig. 8.
Download original image
Polarization fraction as a function of the “mean” optical depth (see Sect. 3.3) for 1D (upper panel) and 2D (lower panel) velocity fields. A schematic representation of the physical models used is shown in Fig. 7. Upper panel: The solid black line shows the analytical results by Kylafis (1983) for CnH2/A = 1 and red squares show our numerical results for the same value of CnH2/A and with ![]() . Green stars and blue circles show our numerical results when we alter the value of
. Green stars and blue circles show our numerical results when we alter the value of ![]() a factor of ten above and below CJ, m → J′, m′. Lower panel: The dashed black and dash-dotted magenta lines show the results from Goldreich & Kylafis (1981) and Lankhaar & Vlemmings (2020a) for CnH2/A = 0.212 and T = 10 K, and blue triangles show results obtained with PYRATE for the same values of CnH2/A and T. Finally, the solid black line and red squares show, respectively, the analytical results by Kylafis (1983) and
a factor of ten above and below CJ, m → J′, m′. Lower panel: The dashed black and dash-dotted magenta lines show the results from Goldreich & Kylafis (1981) and Lankhaar & Vlemmings (2020a) for CnH2/A = 0.212 and T = 10 K, and blue triangles show results obtained with PYRATE for the same values of CnH2/A and T. Finally, the solid black line and red squares show, respectively, the analytical results by Kylafis (1983) and ![]() results for CnH2/A = 1 and T = 30 K.
results for CnH2/A = 1 and T = 30 K.
Current usage metrics show cumulative count of Article Views (full-text article views including HTML views, PDF and ePub downloads, according to the available data) and Abstracts Views on Vision4Press platform.
Data correspond to usage on the plateform after 2015. The current usage metrics is available 48-96 hours after online publication and is updated daily on week days.
Initial download of the metrics may take a while.