Fig. 5.
Download original image
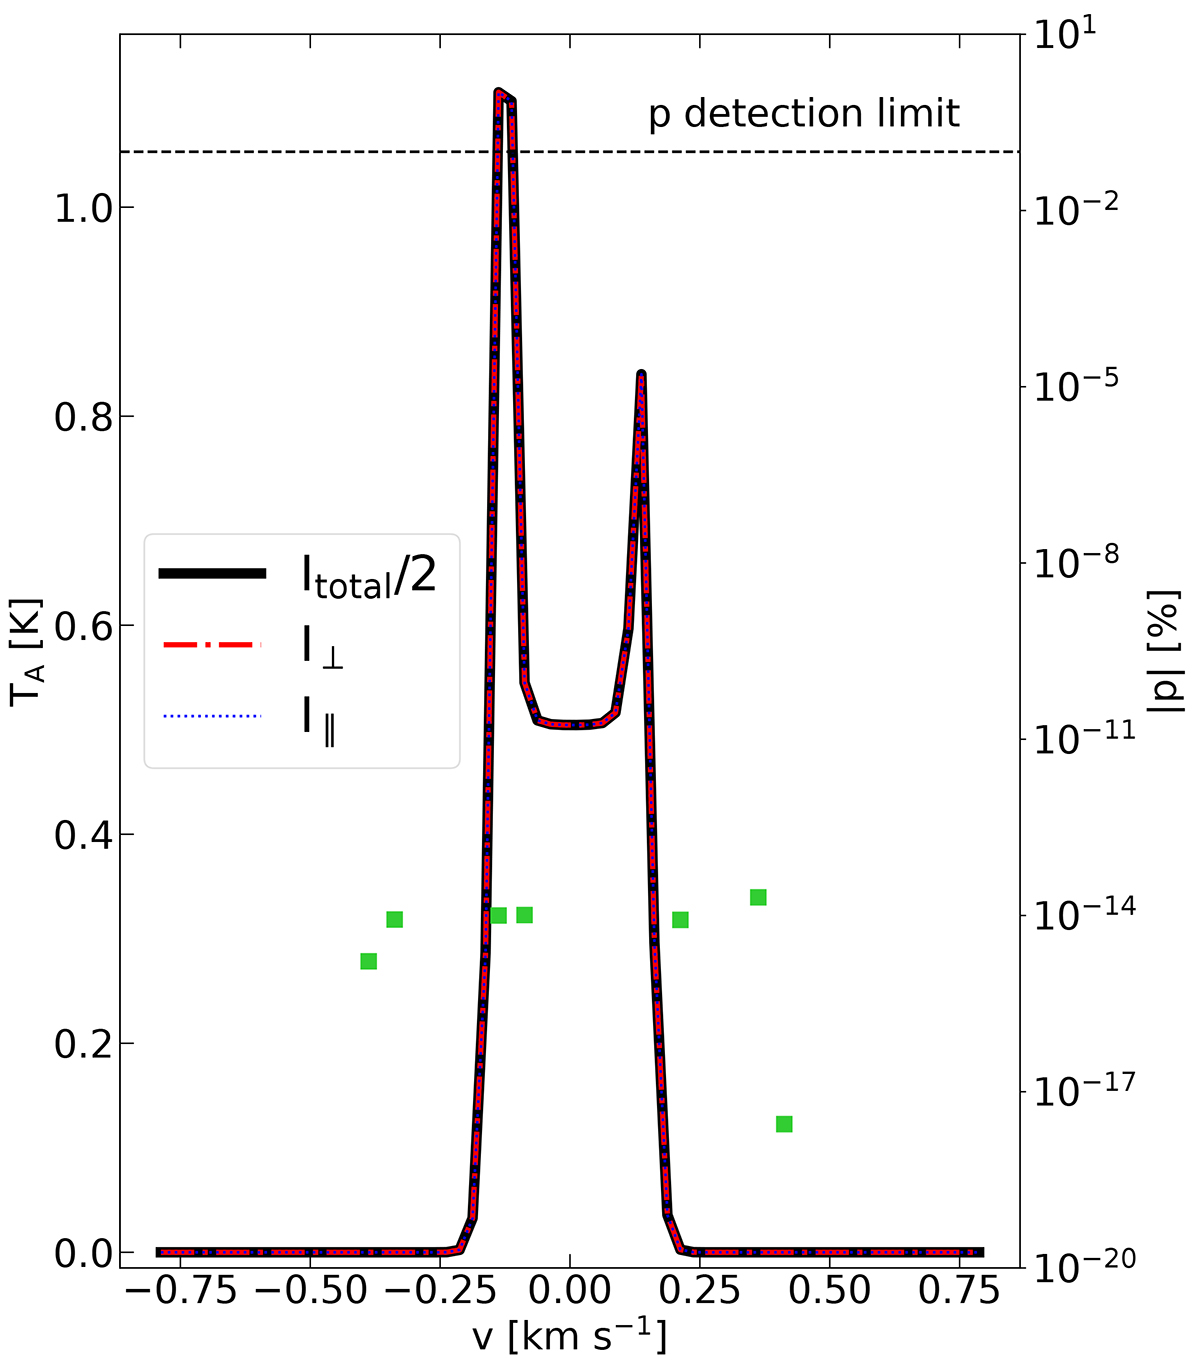
Comparison of the spectrum (in antenna temperature units) computed when the magnetic-sublevel populations are degenerate (solid black line) under LTE conditions, with the spectra polarized perpendicular and parallel to the magnetic field (dash-dotted red and dotted blue lines, respectively), computed when the magnetic sublevels are explicitly considered in the detailed balance equations. All spectra are from the central cell (R = Z = 0). The green points show the polarization fraction (right y axis). With the dashed black line we mark a lenient detection limit of 0.1% polarization. As was expected, under LTE conditions, I⊥ = I∥ = Itotal/2 and the polarization fraction is zero to numerical accuracy (note that the right y axis is in logarithmic scale spanning twenty-one orders of magnitude). The underlying physical model used for these radiative-transfer simulations is shown in Fig. 3.
Current usage metrics show cumulative count of Article Views (full-text article views including HTML views, PDF and ePub downloads, according to the available data) and Abstracts Views on Vision4Press platform.
Data correspond to usage on the plateform after 2015. The current usage metrics is available 48-96 hours after online publication and is updated daily on week days.
Initial download of the metrics may take a while.