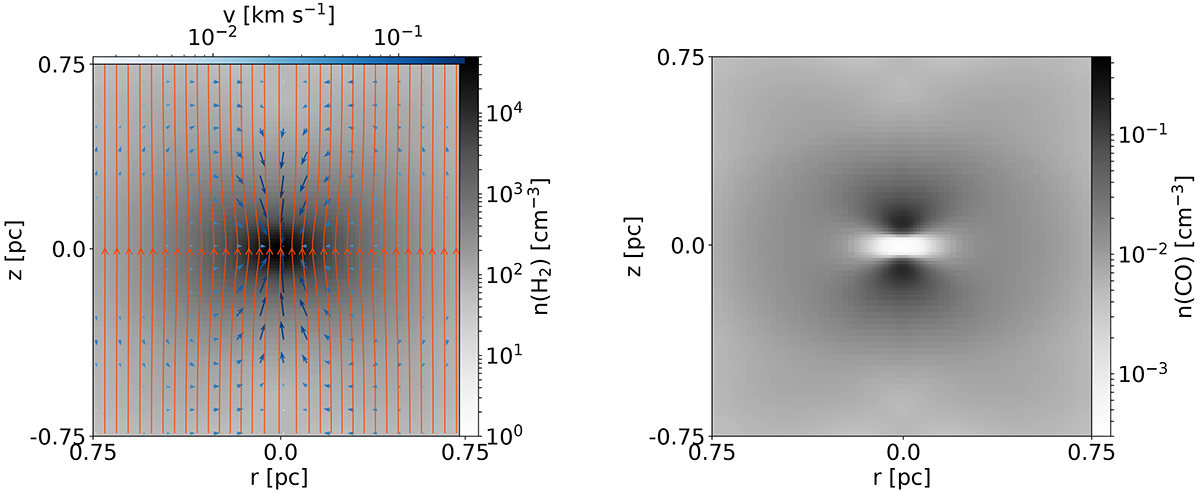
Fig. 3.
Download original image
H2 and CO number densities (left and right panels, respectively) from a nonideal MHD chemo-dynamical simulation. Orange streamlines in the left panel depict the magnetic field lines and the color-coded vectors show the velocity in the cloud. This simulation is used as the underlying physical model in Sect. 3.1, Sect. 3.2, and Sect. 4.
Current usage metrics show cumulative count of Article Views (full-text article views including HTML views, PDF and ePub downloads, according to the available data) and Abstracts Views on Vision4Press platform.
Data correspond to usage on the plateform after 2015. The current usage metrics is available 48-96 hours after online publication and is updated daily on week days.
Initial download of the metrics may take a while.