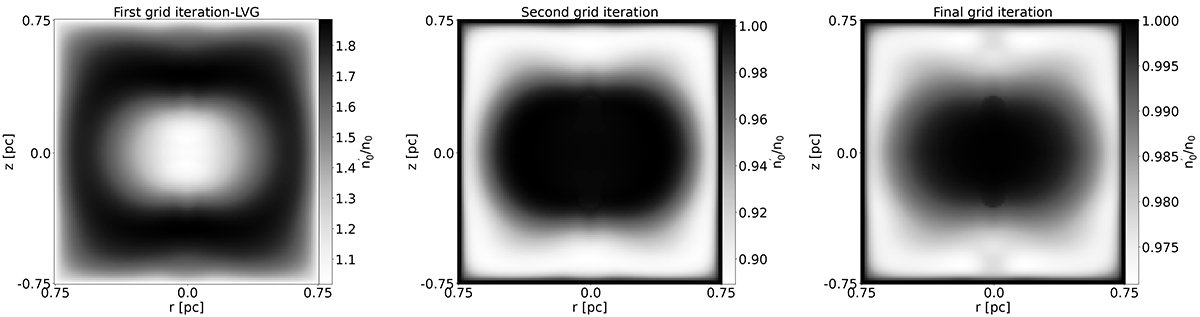
Fig. C.1.
Download original image
Comparison between the population of J = 0 calculated using the approach described in Sect. 2 (n0) against the population of J = 0 calculated using the methodology described in Sect. C. In the latter case, the coupling between the level populations in different regions of the cloud is explicitly taken into account by performing multiple iterations over the entire grid. The method described in Sect. 2 is accurate within 3% while at the same time the code is ∼10 times faster. In both cases, we use as input the physical model shown in Fig. 3 and use J ≤ 5.
Current usage metrics show cumulative count of Article Views (full-text article views including HTML views, PDF and ePub downloads, according to the available data) and Abstracts Views on Vision4Press platform.
Data correspond to usage on the plateform after 2015. The current usage metrics is available 48-96 hours after online publication and is updated daily on week days.
Initial download of the metrics may take a while.