Fig. 10.
Download original image
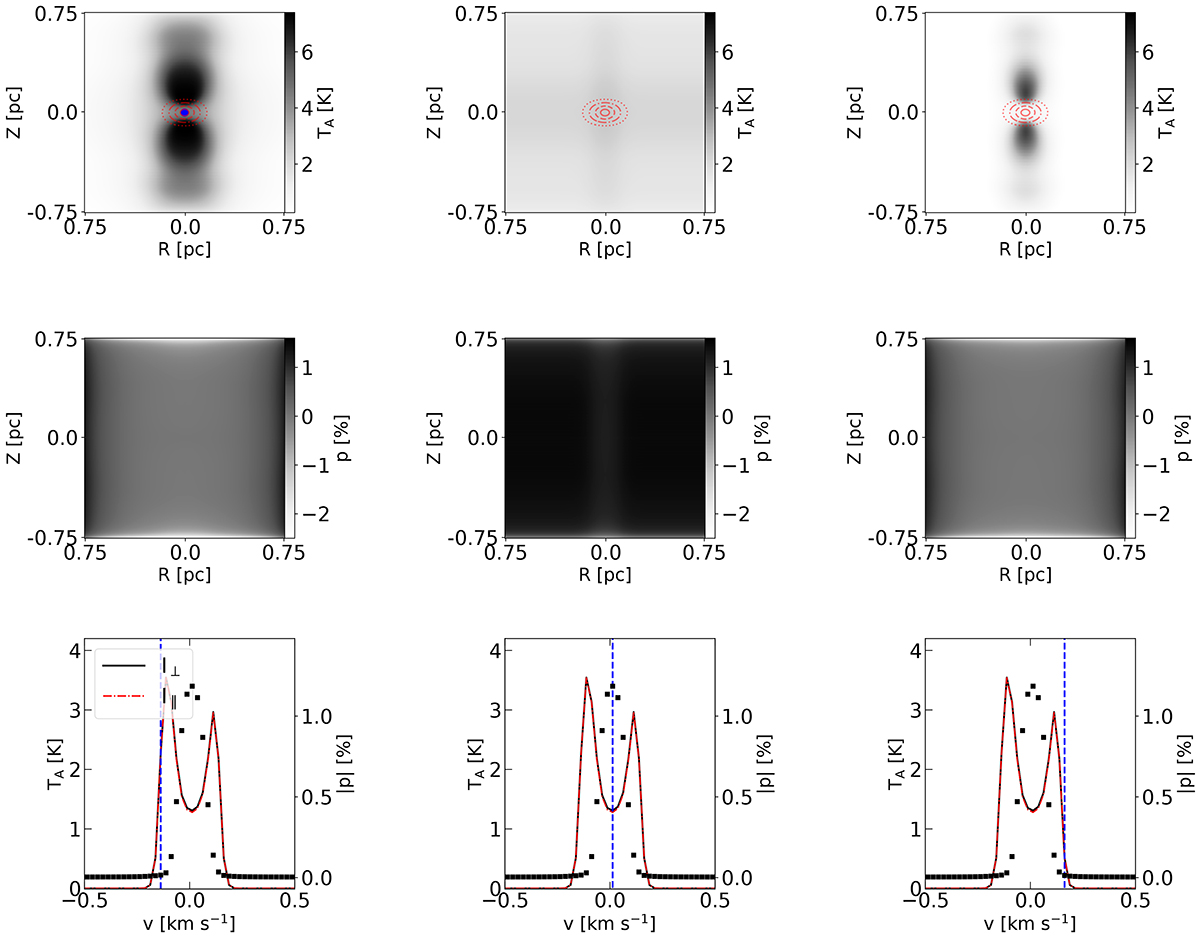
Results from our radiative-transfer simulation for the J = 1 → 0 transition for the chemo-dynamical simulation shown in Fig. 3. Upper row: Slices through the simulated PPV data cube for the velocities marked with the dashed blue lines in the lower row where we additionally show spectra at the center of the core. In each panel we have overplotted the actual density structure of the core with red contours. Middle row: Fractional polarization in each velocity slice. Bottom row: Spectra toward the center of the core (see blue point in the upper left panel; R = Z = 0) together with the polarization fraction (black squares) for this location in the cloud. With the black line we show the radiation polarized perpendicular to the magnetic field and with the red line we show the radiation polarized parallel to the magnetic field. For the physical conditions of the cloud shown in Fig. 3 the maximum fractional polarization is observed for the rest frequency of the line (middle panel in the second row).
Current usage metrics show cumulative count of Article Views (full-text article views including HTML views, PDF and ePub downloads, according to the available data) and Abstracts Views on Vision4Press platform.
Data correspond to usage on the plateform after 2015. The current usage metrics is available 48-96 hours after online publication and is updated daily on week days.
Initial download of the metrics may take a while.