Fig. 4
Download original image
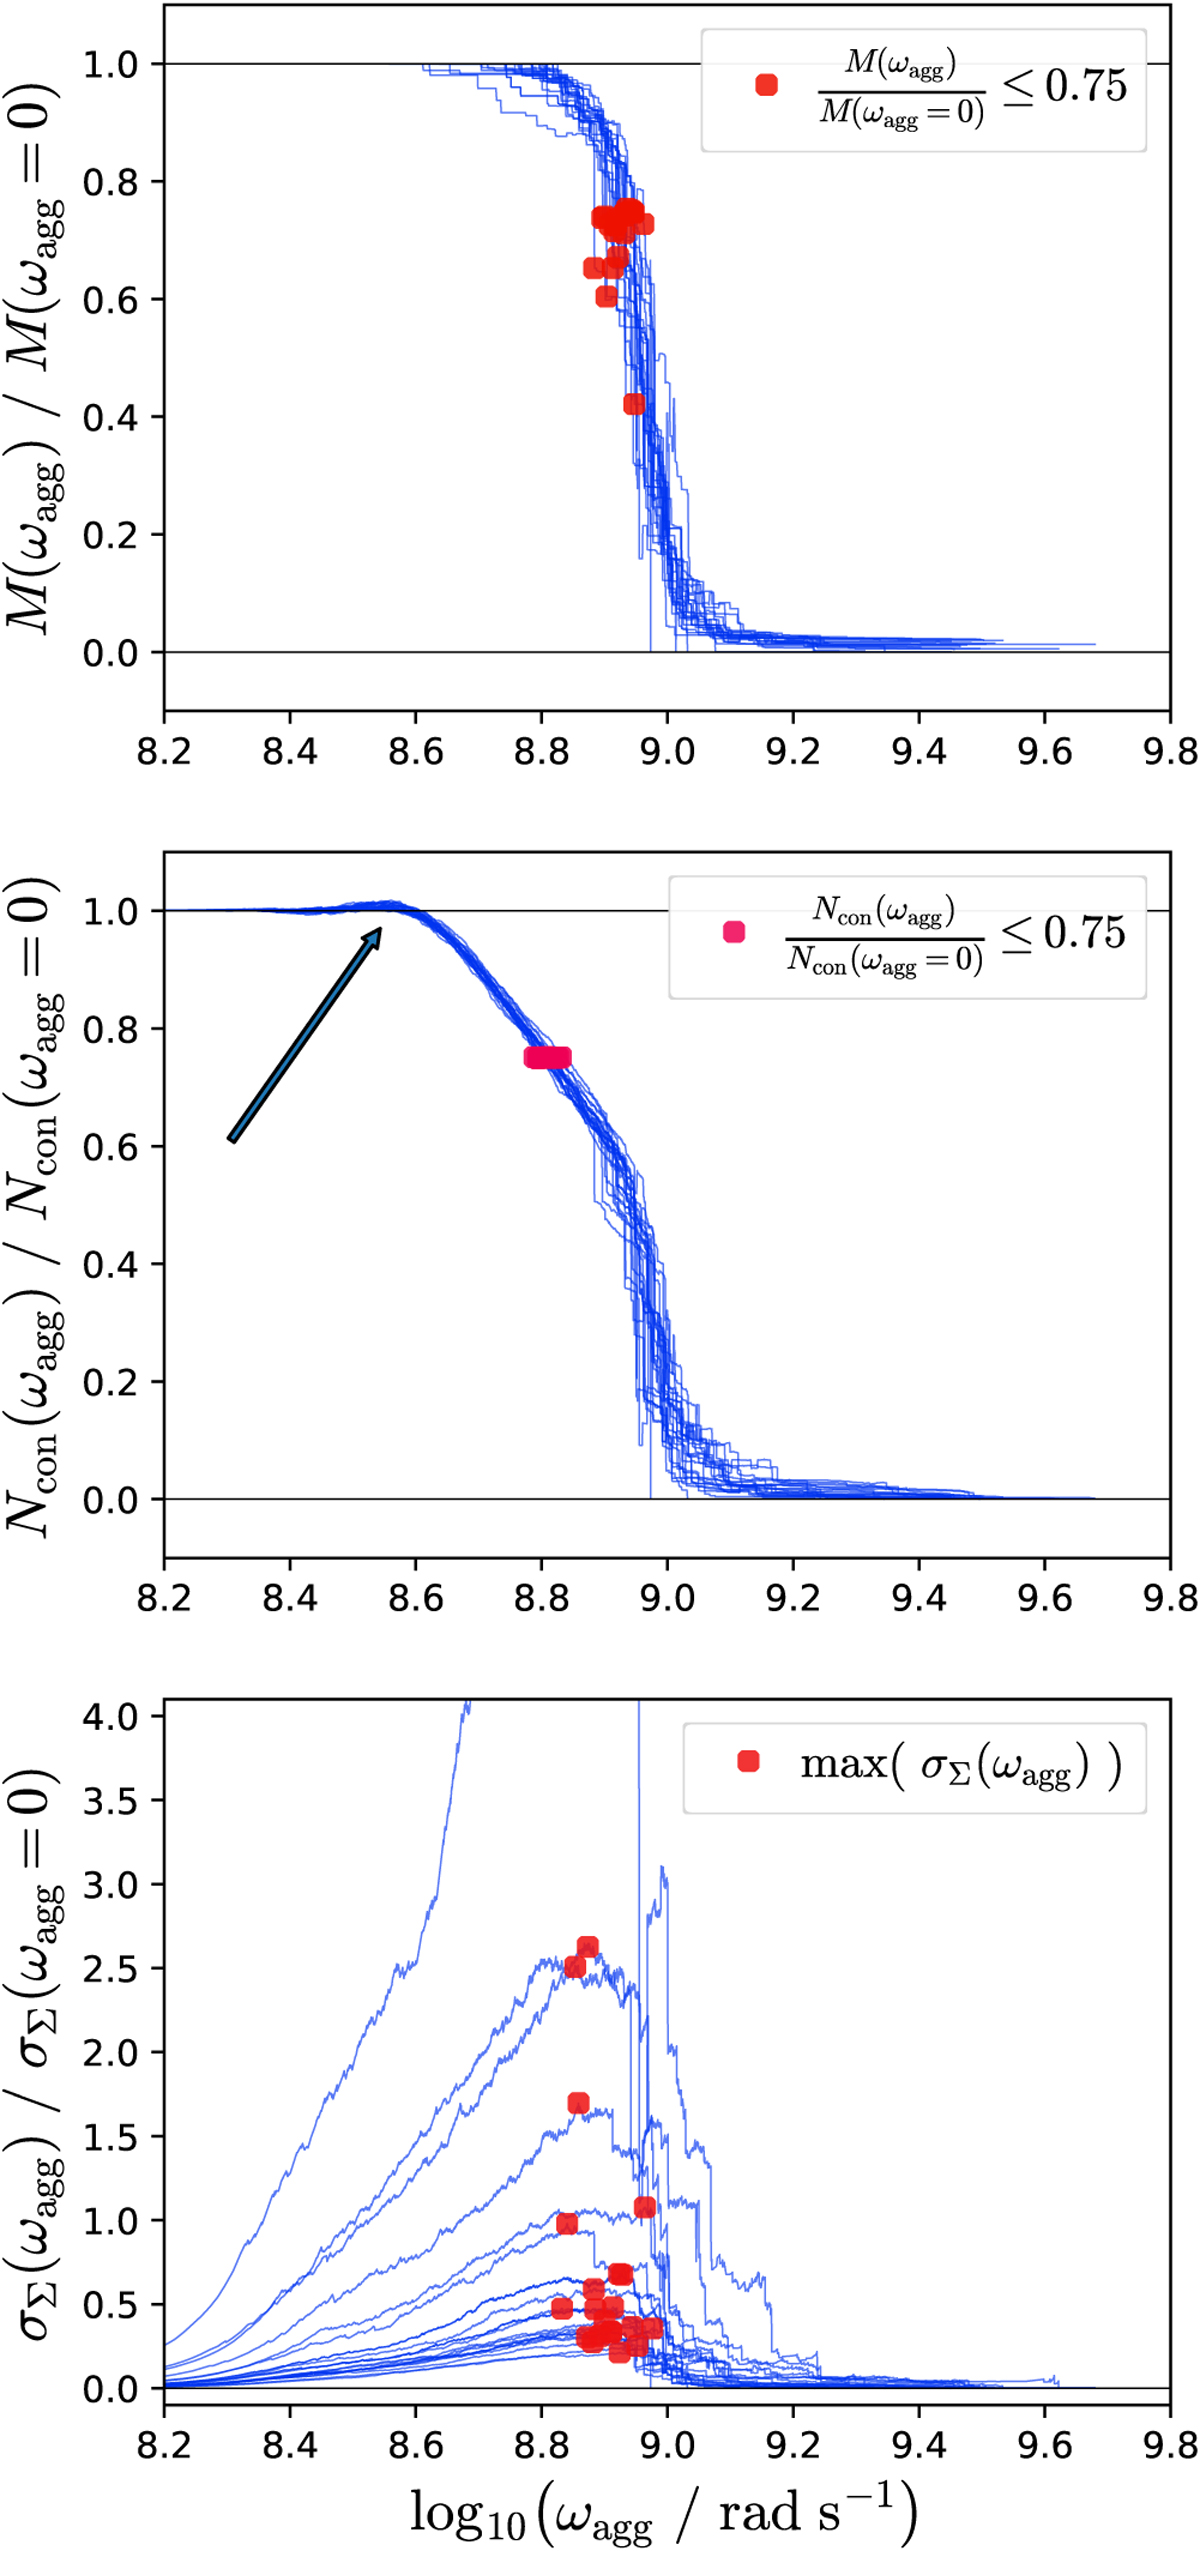
Evolution of the mass M(ωagg) (top panel), number of connections Ncon(ωagg) (middle panel), and total stress σΣ(ωagg) (bottom panel) within the largest fragment dependent on the increasing angular velocity ωagg. The blue lines represent the exemplary ensemble of q-S BAM2 grains with aeff = 350 nm. An arrow points to the peak value of the number of connections, Ncon. Red dots indicate the characteristics angular velocity, ωagg, where an individual aggregate has lost for the first time more than 25 % of its initial mass, initial number of connections, or reached its peak stress.
Current usage metrics show cumulative count of Article Views (full-text article views including HTML views, PDF and ePub downloads, according to the available data) and Abstracts Views on Vision4Press platform.
Data correspond to usage on the plateform after 2015. The current usage metrics is available 48-96 hours after online publication and is updated daily on week days.
Initial download of the metrics may take a while.