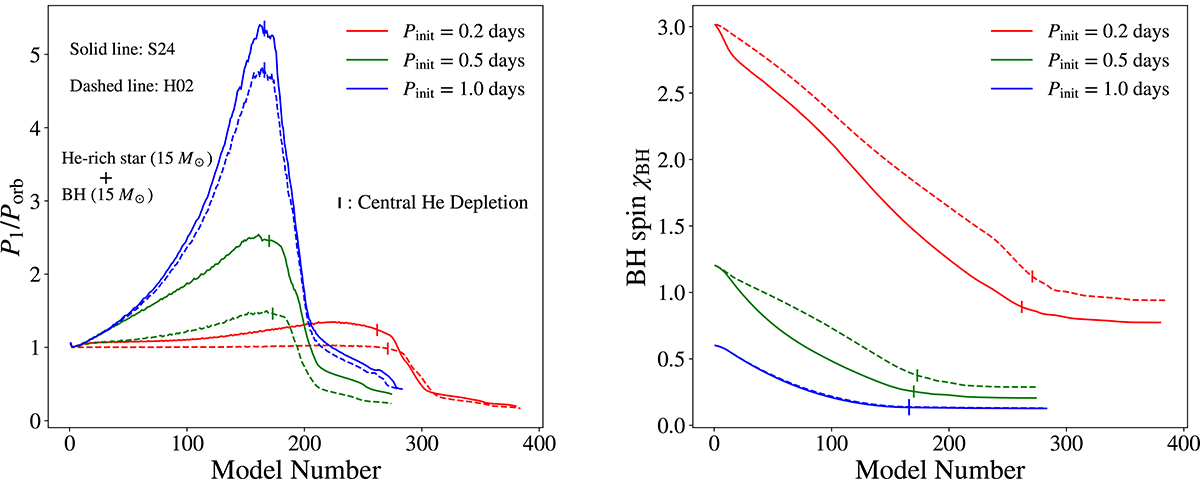
Fig. A.3.
Download original image
The ratio of the He-rich star’s rotational period to the orbital period (P1/Porb, left panel) and the resulting BH spin (χBH, right panel) are plotted as functions of model number for different initial orbital periods (red: 0.2 days; green: 0.5 days; blue: 1.0 days). Two synchronization timescales are compared: the solid line represents τsync from Sciarini et al. (2024), while the dashed line corresponds to τsync from Hurley et al. (2002). Vertical lines indicate the point at which the He-rich star reaches central helium depletion.
Current usage metrics show cumulative count of Article Views (full-text article views including HTML views, PDF and ePub downloads, according to the available data) and Abstracts Views on Vision4Press platform.
Data correspond to usage on the plateform after 2015. The current usage metrics is available 48-96 hours after online publication and is updated daily on week days.
Initial download of the metrics may take a while.